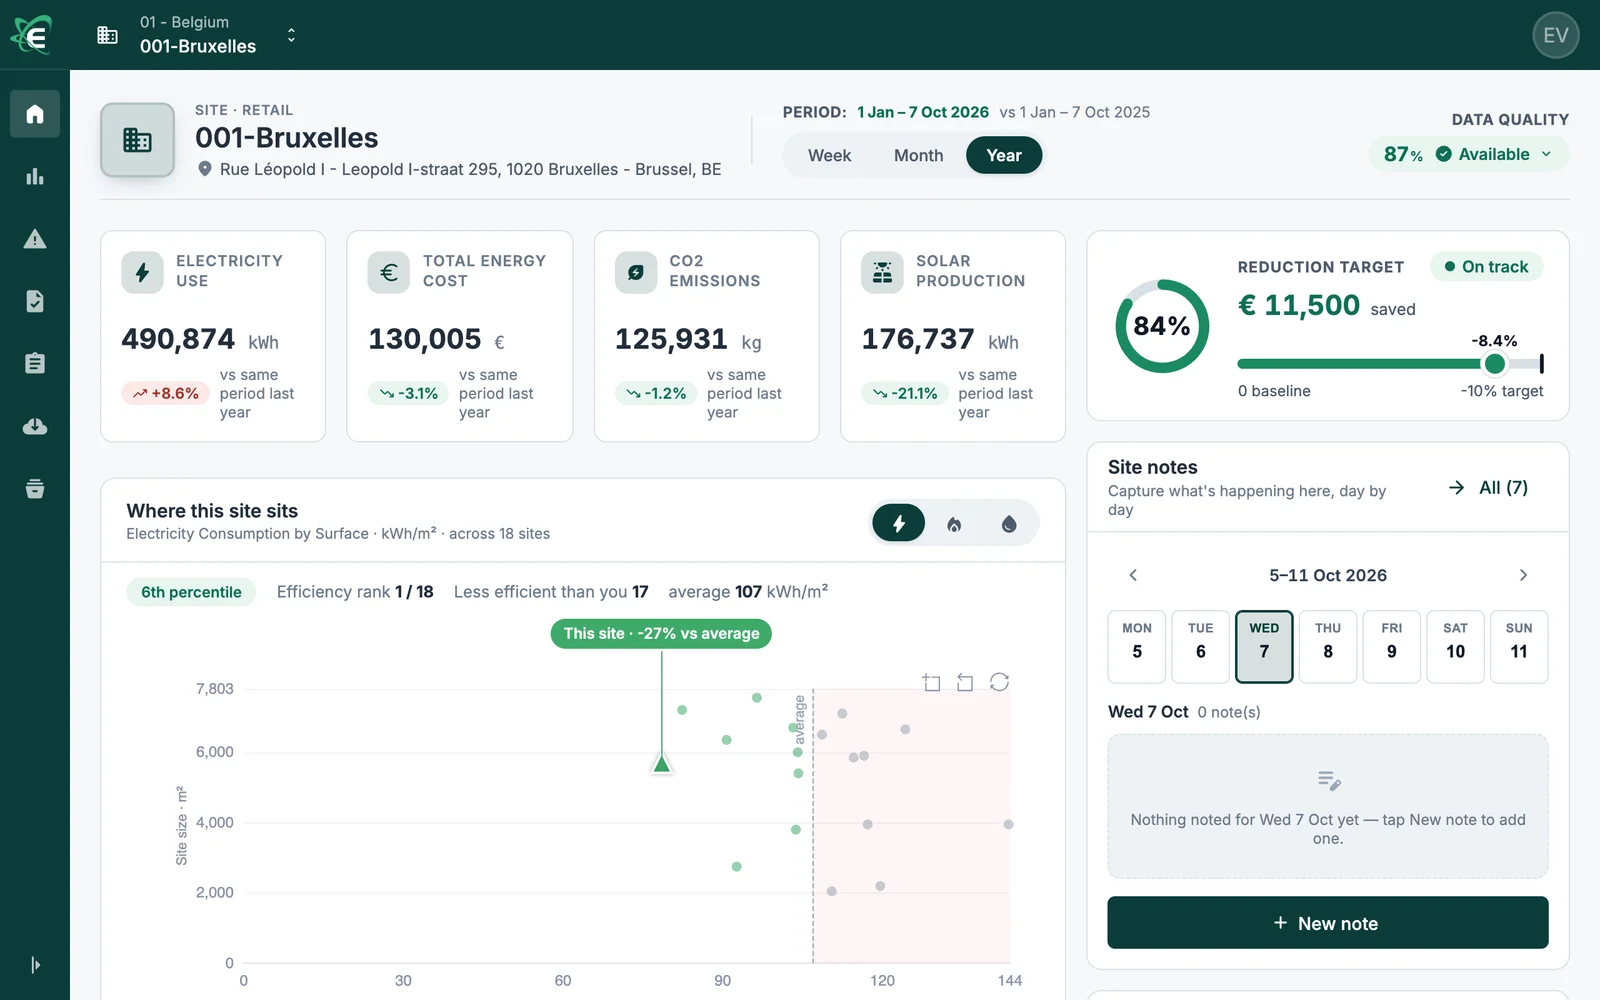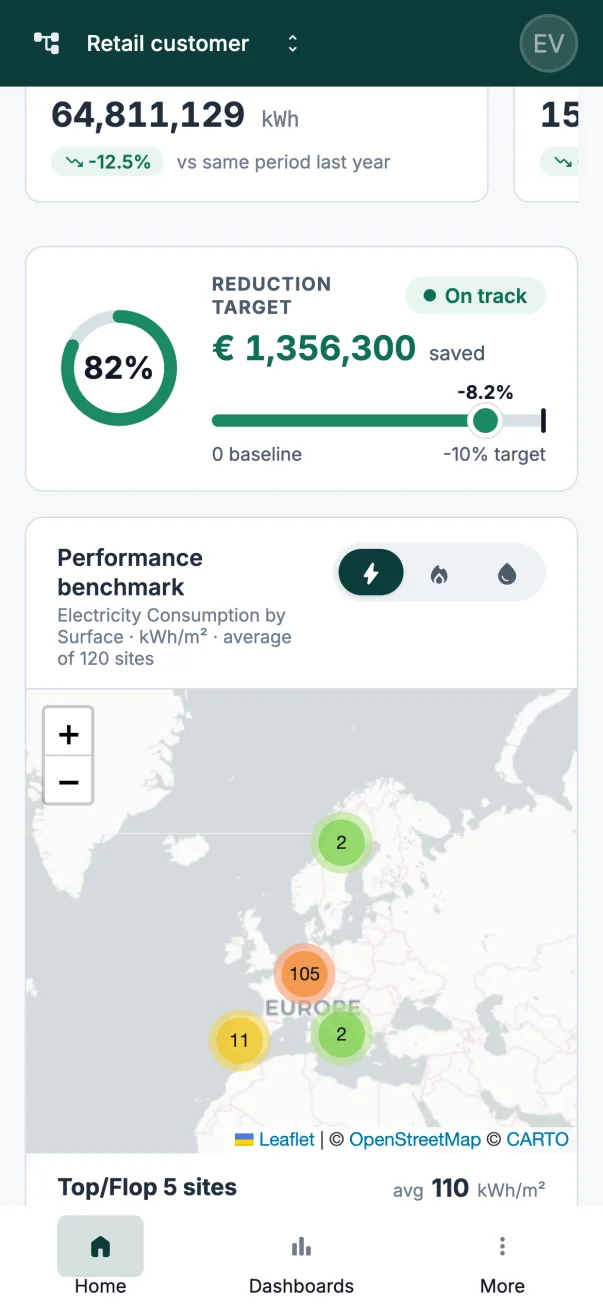


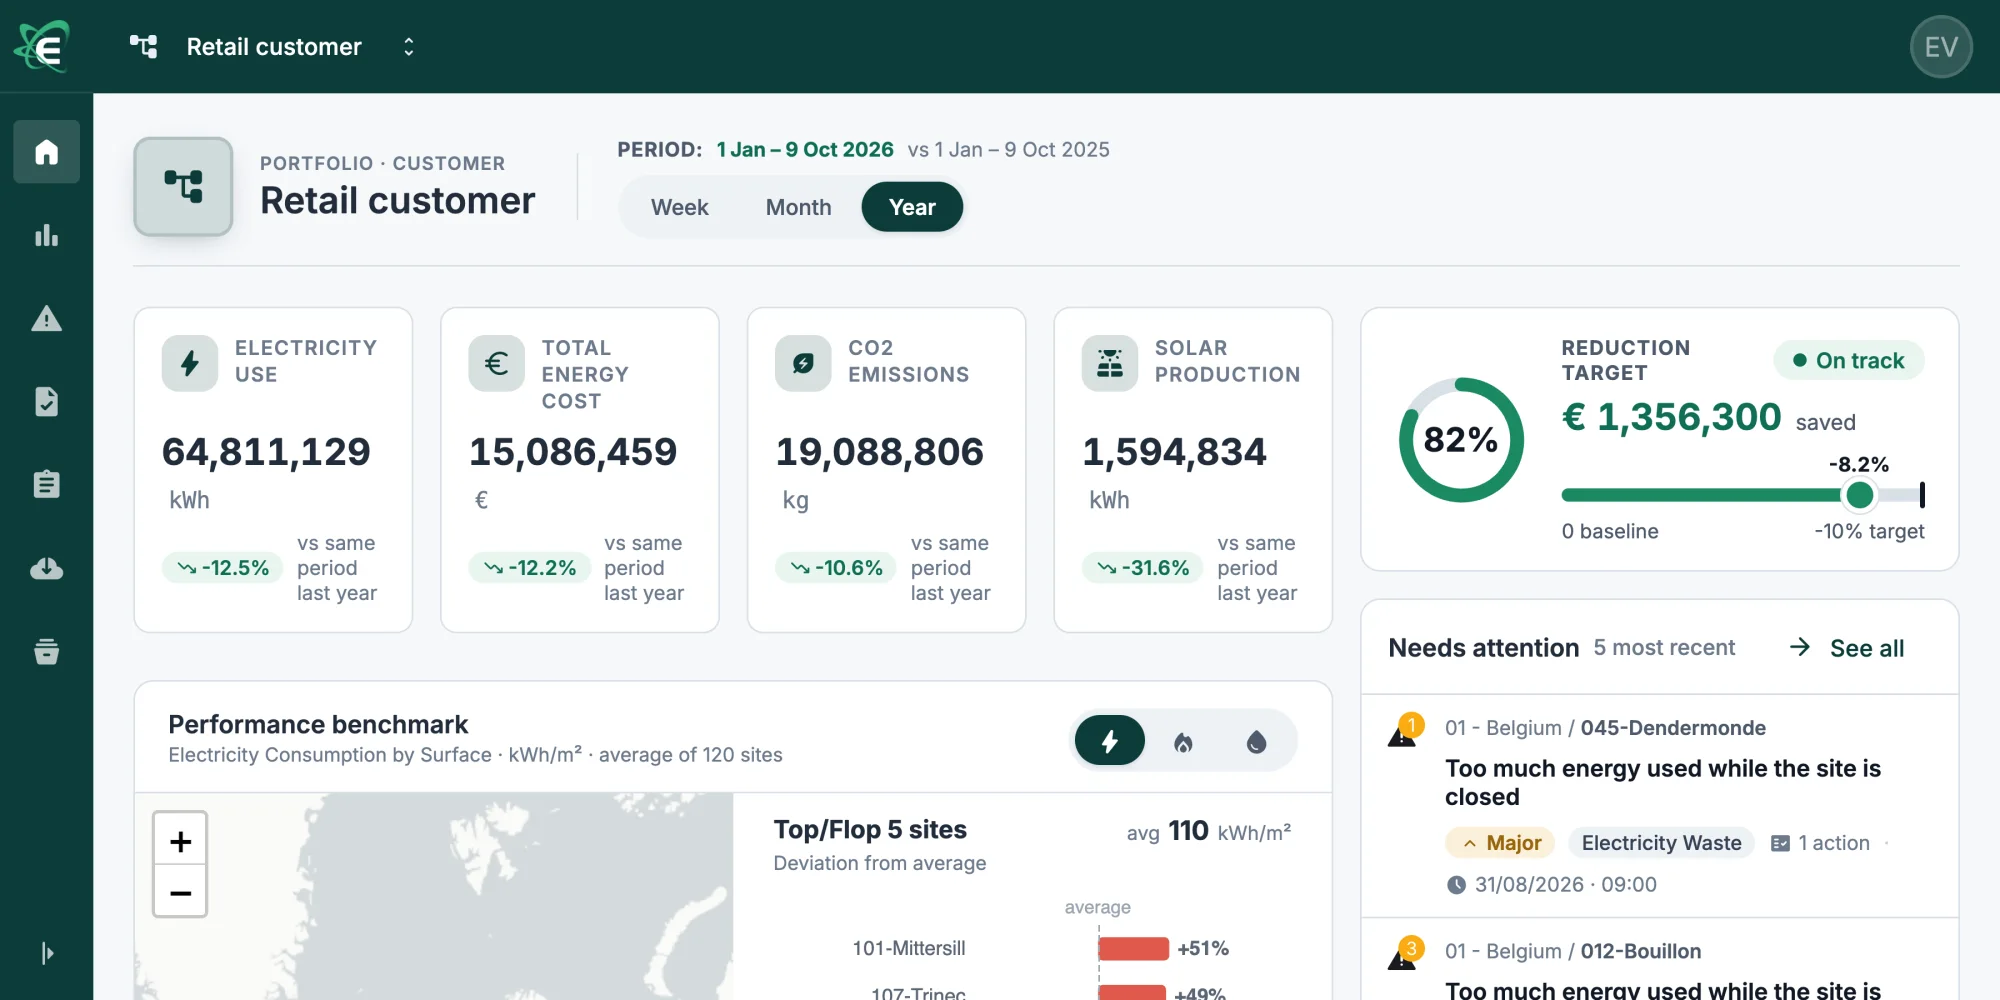
Multi-site energy management
Keep energy under control on every site
One standard for every site and every country. Waste is found every night, the people on site act on it, and you prove the savings.
- 3,000+ sites in Europe on one platform at Action
- On average, the sites we analysed used about 7% less electricity a year
For every type of building you run
Each type of building gets the measures and the ready-made apps that fit it.
Retail
Most of the waste happens when the doors are closed. Every night, each site is checked against its own baseline, from grid-operator data.
- 53,564 retail sites monitored
- 5 customers run or serve retail chains

Energis.Cloud serves as Action's single, unified platform for monitoring the energy consumption of its more than 3,000 sites throughout Europe.
Real estate
Owners need figures they can compare: kWh per m², benchmarks between buildings and consumption per tenant.
- 327 office buildings monitored
- 5 customers manage or serve real estate
Hospitality
Guests expect comfort around the clock, so the installations never rest. Leaks and faults are found the same day, before they become costly.
- 123 hotels and hospitality sites monitored
- 3 customers in hospitality
- +5% energy savings per year, The Hotel Brussels

Customer story · The Hotel Brussels
Leaks and faults found the same day
Healthcare
Campuses run day and night. With every building and installation metered, the night-time base load and a failing installation show up early.
- 36 healthcare sites monitored
- 6 customers run or serve healthcare buildings
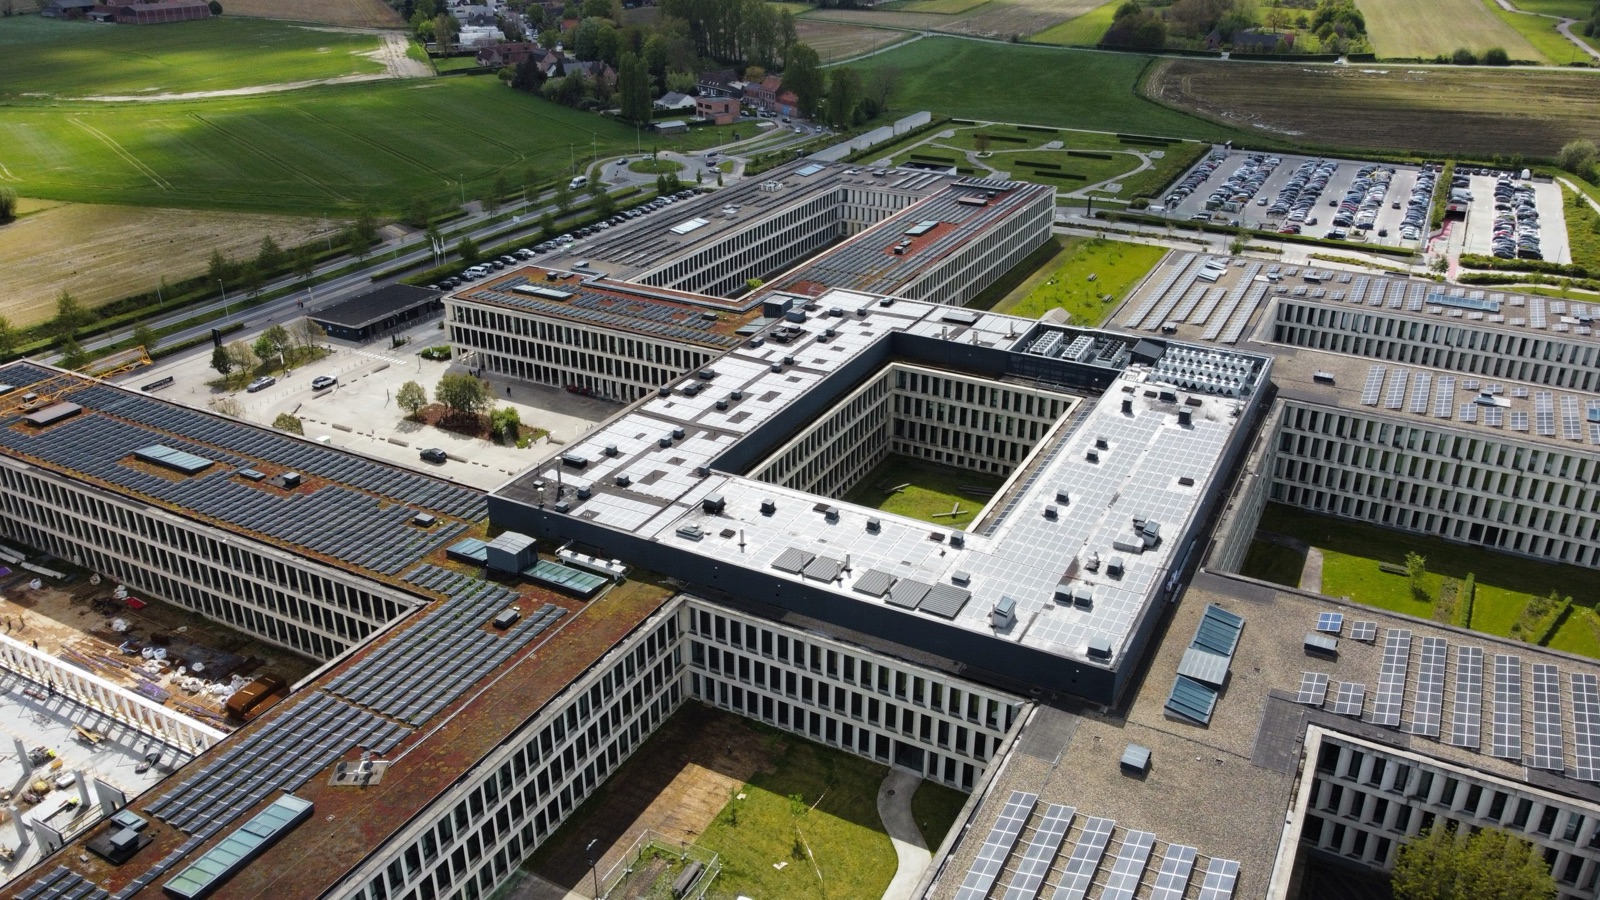
- −23% electricity of the Park building in 2023, AZ Groeninge
Customer story · AZ Groeninge
23% less electricity in the Park building
Public buildings
Schools, town halls and sports halls need healthy rooms on a tight budget: CO₂ and comfort per room, kWh per m² or per pupil.
- 252 public and education sites monitored
- 6 customers in public buildings
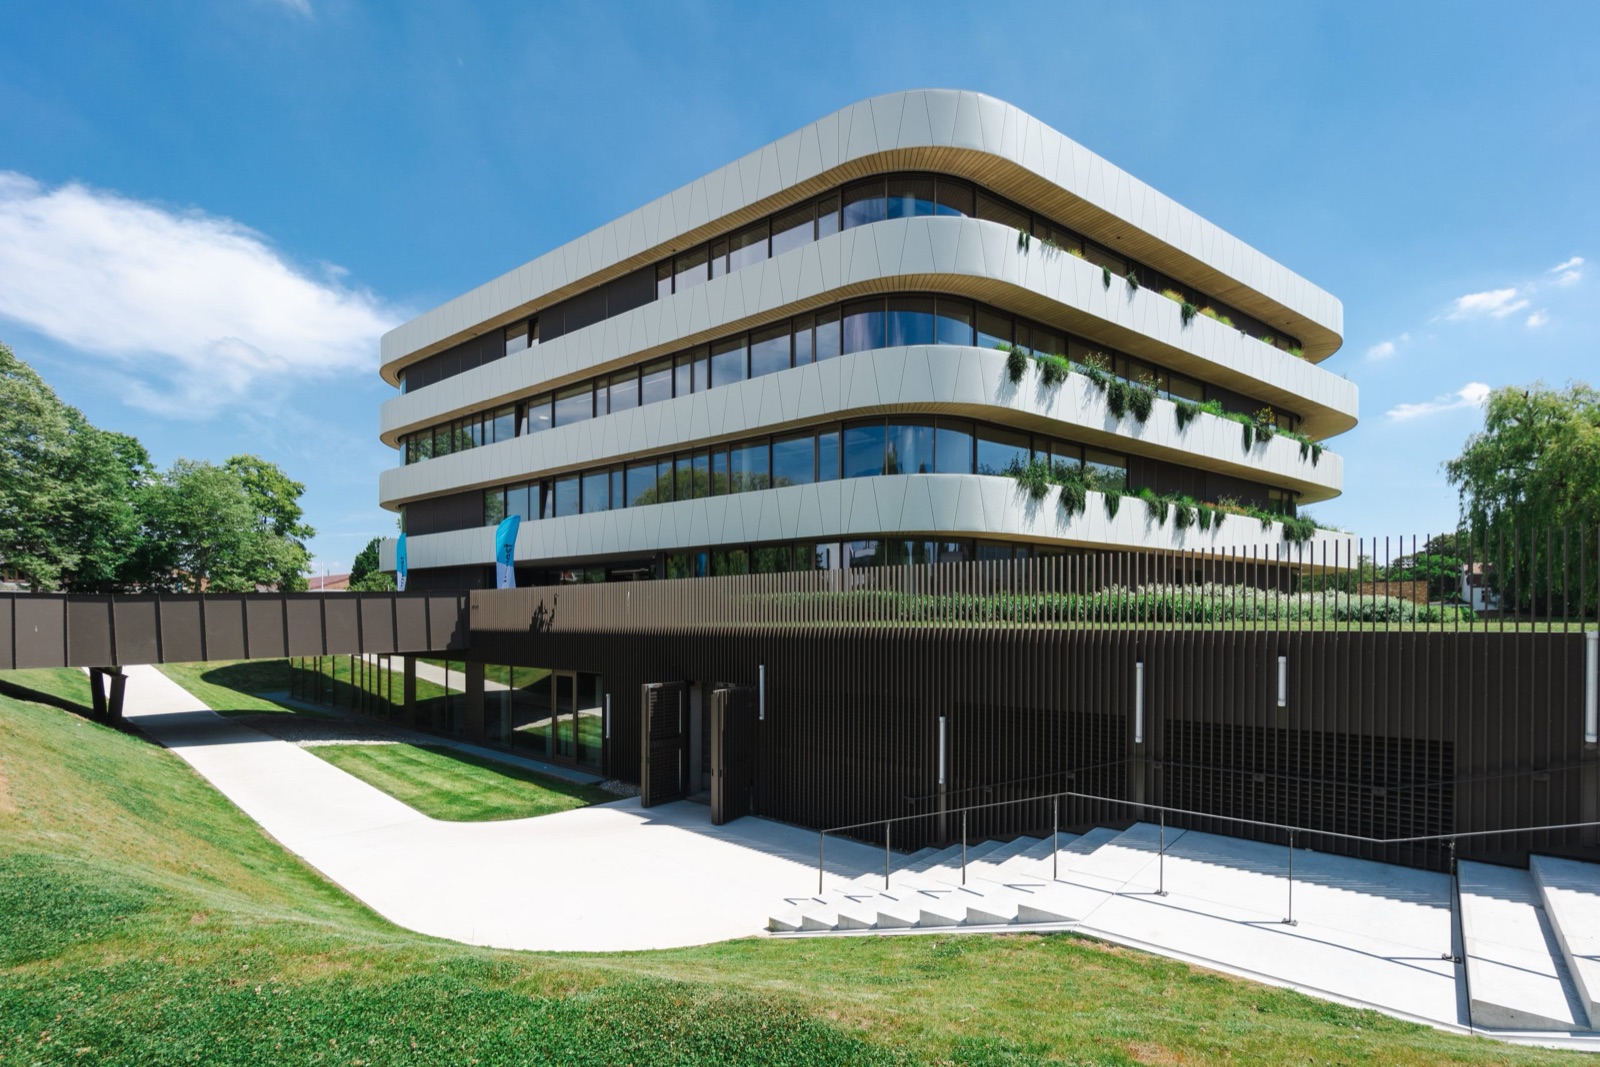
- €209,750 saved in 2022 through self-consumption of cogeneration and solar power, Howest
Customer story · Howest
Measuring the savings of cogeneration and solar
Industrial
Energy is a cost per unit produced. Sub-meters per line show energy per unit, compressed air and what each project saves.
- 113 industrial sites monitored
- 9 customers in industry
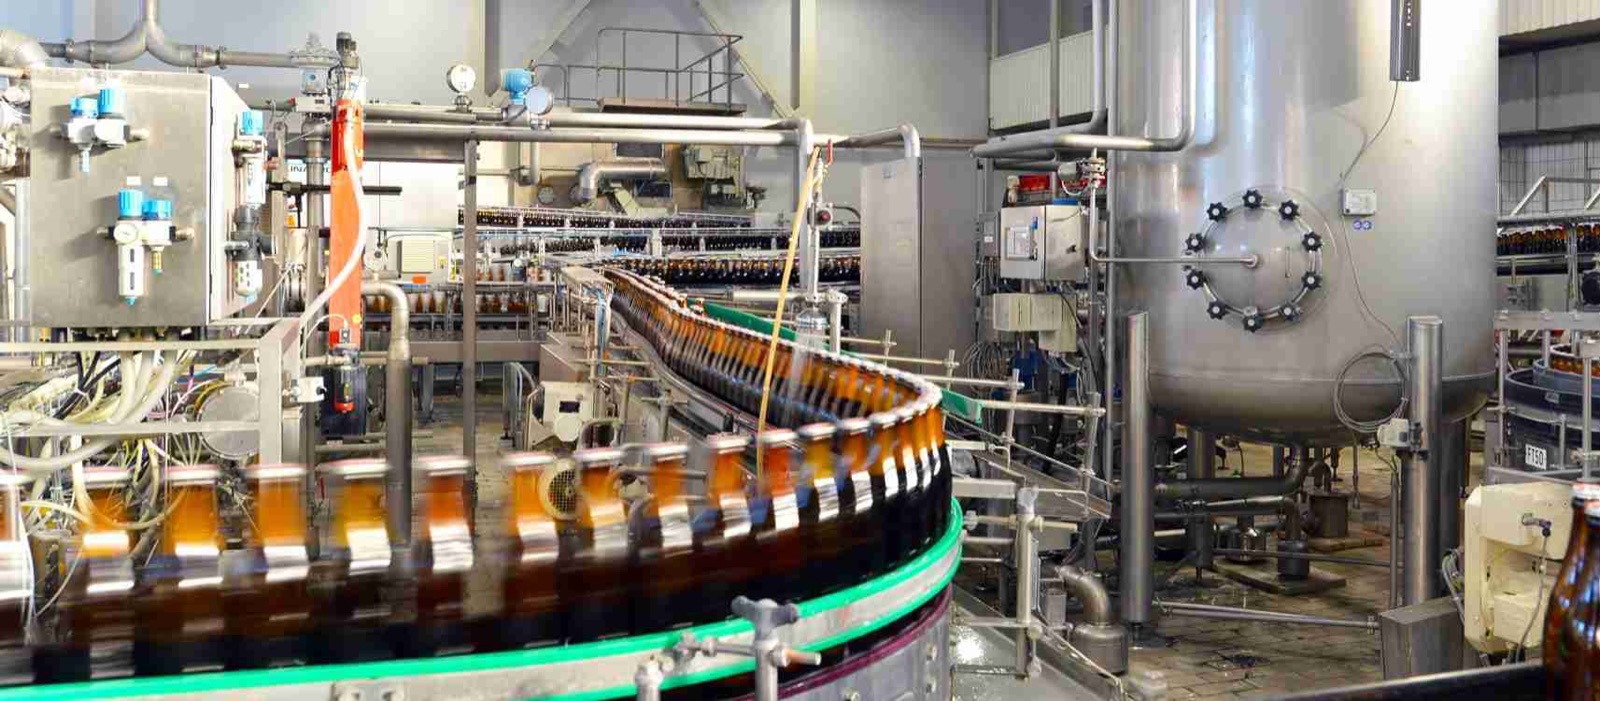
- €88,000 saved in one year, A brewery in Cameroon
Customer story · A brewery in Cameroon
620 MWh saved in one year
How a small team runs hundreds of sites
The central energy team sets the standard once. The platform runs it on every site, and the people on site act.
Collect
Data comes from grid operators in every country, with your mandate, and from your gateways, meters and building systems. No hardware is added where none is needed.
Structure
Sites grouped by country, region and banner, with their floor area and opening hours. A new site starts from the same set-up.
Analyse
Consumption per m², cost and the drop after closing, compared across sites and countries, with a target per site in euros and kWh.
Detect and act
Every night, rules check every site against its own baseline; the site manager receives the anomaly, and a repeated one escalates.
Explain Orbit
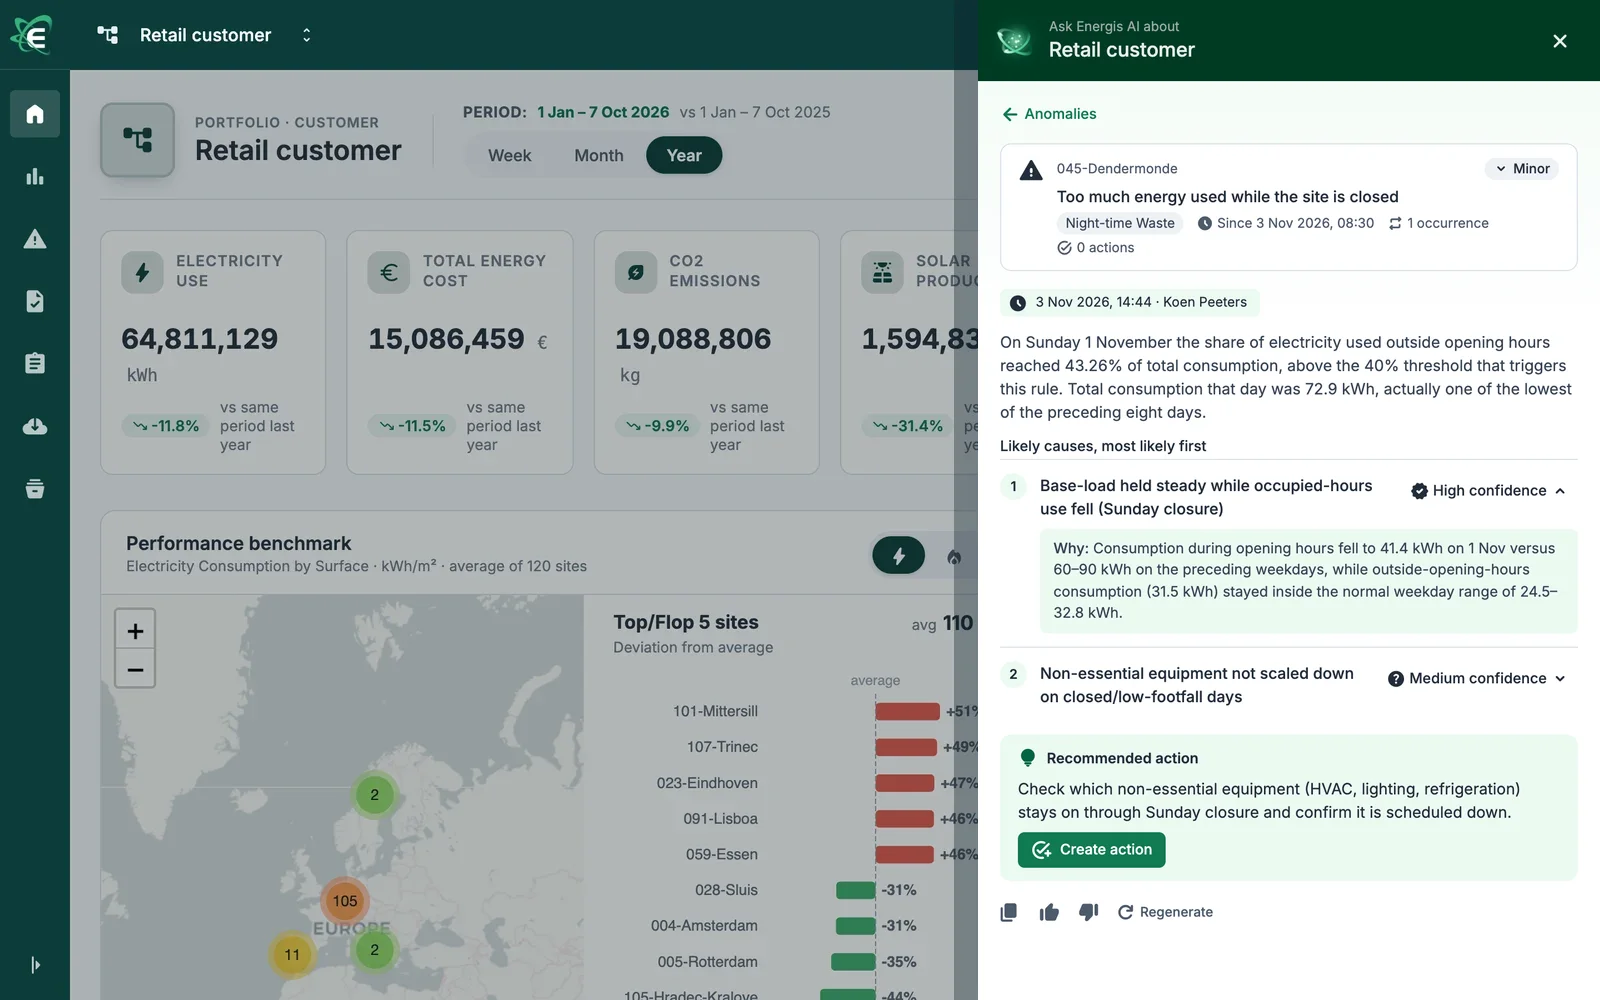
Orbit ranks the likely causes of an anomaly and recommends the next step, and the person on site writes what happened as a memo.
Prove and communicate
Measured savings, monthly reports per region and the data your obligations ask for, sent on schedule.
In use every day
The work Energis.Cloud takes off your central team's desk
Figures as of Across all Energis.Cloud customers.
The cause, not only the anomaly
Orbit reads the data, the anomalies and the actions of a site together. It ranks the most likely causes and recommends the next step, so the site manager knows what to check before walking the building.
Savings you can prove
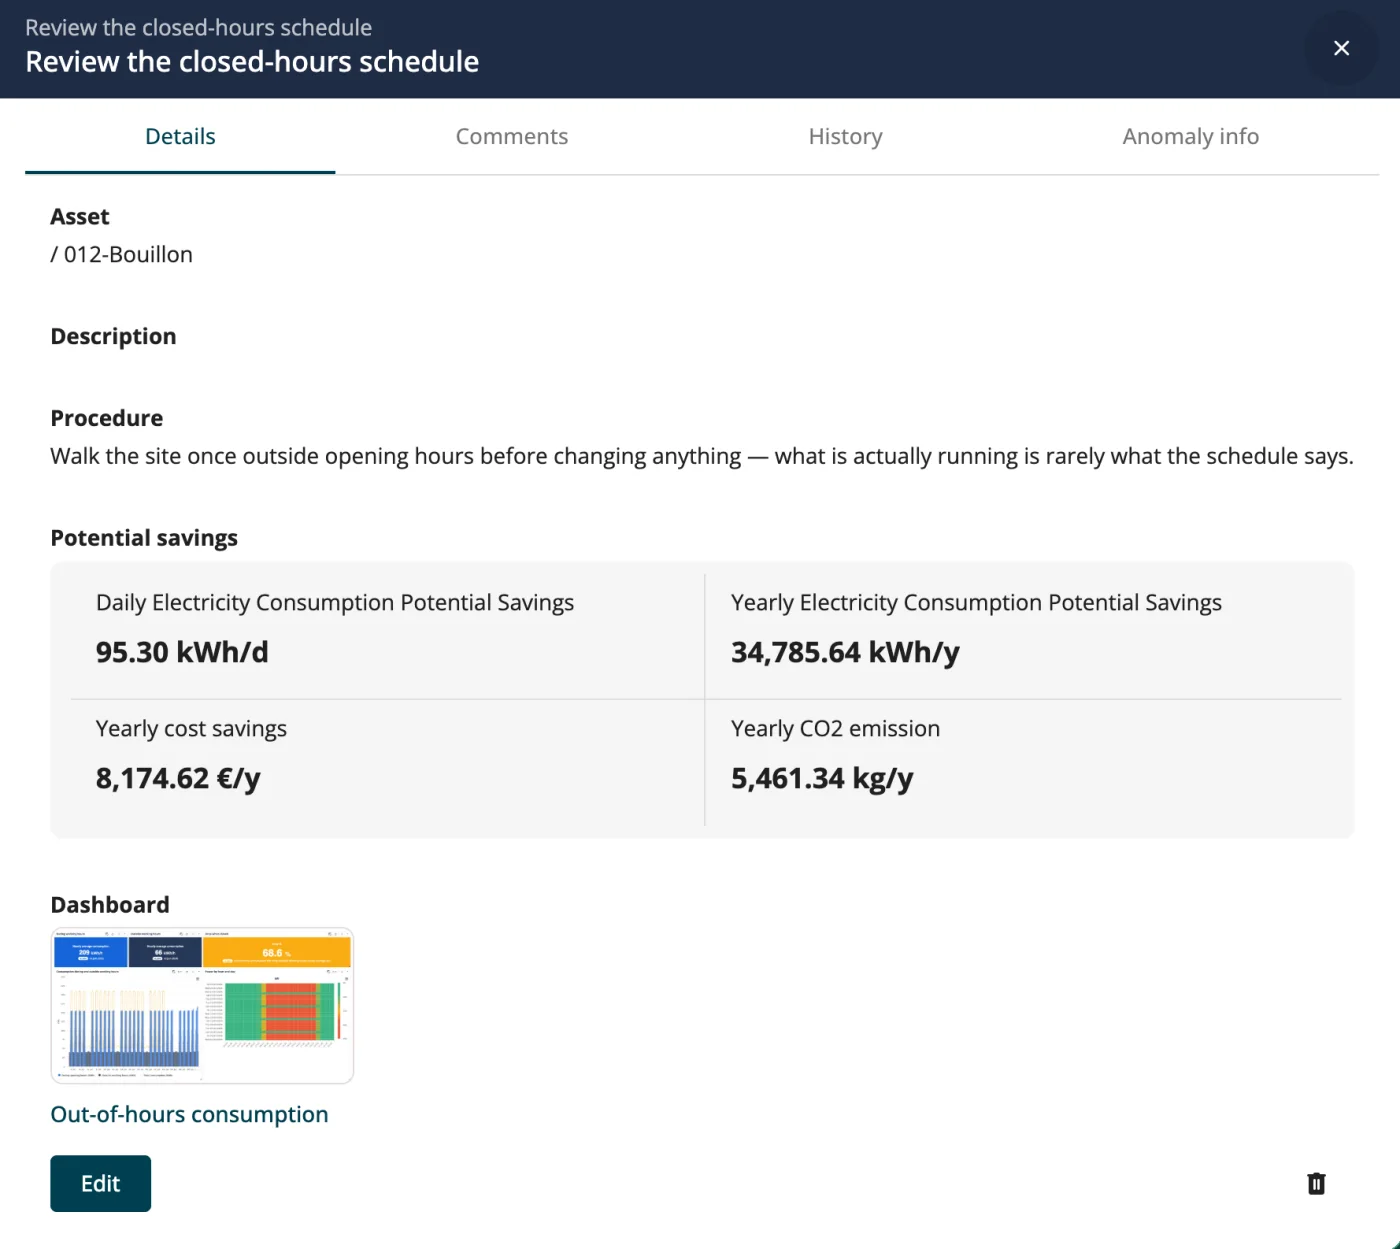
Every action carries its estimated saving from the day it is created, and the Savings Tracker app measures what each site saved against its own weather-adjusted baseline, in kWh and in euros, following IPMVP. We analysed 3,024 sites of 7 customers with three years of complete data (2022 to 2024): on average, they used about 7% less electricity each year.
Every obligation, supported by the same data
Energis.Cloud does not certify a site or file a report for you. It keeps the measured data and the audit trail each obligation relies on.
ISO 50001 and energy audits
Energy performance indicators, actions with an owner and a realised saving, memos that explain each change, and the history an energy audit starts from.
BACS
Reads your building automation, keeps the history and raises an anomaly when a site drifts.
CSRD and carbon reporting
Consumption and emissions per site from measured data and your emission factors, exported for your sustainability report.
EPC NR and energy certificates
The measured consumption behind each non-residential building's certificate, such as the EPC NR in Flanders.
Décret Tertiaire and national targets
Consumption per site against a reference year, weather-adjusted, for decrees such as France's Décret Tertiaire and retail commitments such as Perifem.
IPMVP measurement and verification
Savings measured against a weather-adjusted baseline, in line with IPMVP, for every project you invest in.
ISO 50001 and energy audits
Energy performance indicators, actions with an owner and a realised saving, memos that explain each change, and the history an energy audit starts from.
BACS
Reads your building automation, keeps the history and raises an anomaly when a site drifts.
CSRD and carbon reporting
Consumption and emissions per site from measured data and your emission factors, exported for your sustainability report.
EPC NR and energy certificates
The measured consumption behind each non-residential building's certificate, such as the EPC NR in Flanders.
Décret Tertiaire and national targets
Consumption per site against a reference year, weather-adjusted, for decrees such as France's Décret Tertiaire and retail commitments such as Perifem.
IPMVP measurement and verification
Savings measured against a weather-adjusted baseline, in line with IPMVP, for every project you invest in.
What multi-site energy teams say

Energis.Cloud is a management tool that allows us to manage 300 sites at the same time. It is effective and enables us to meet the requirements of the ISO 50001 standard.
Arnaud GasnierEnergy Project Manager, Fnac Darty Energis.Cloud serves as Action's single, unified platform for monitoring the energy consumption of its more than 3,000 sites throughout Europe.
ActionRetail, more than 3,000 sites in Europe - Howest
You can make a lot of correlations with the data so that further improvements are possible.
Jurgen Van RyckeghemTeacher and Research Coordinator, Howest
Read the story
FAQ
Questions multi-site energy teams ask us
We don't own most of our buildings. How do you get the data?
From the grid operator or the metering company, with your mandate, read on a schedule with no hardware on site. Our 121 data-source connectors cover grid operators and metering companies in many countries, next to gateways, meters and building systems. Where a building needs sub-metering, our field device or the building's own system sends the data.
Can Finance rely on the figures?
Every meter shows the readings it sent against those expected, so each figure says how far it can be trusted. A wrong value is corrected with every change kept on record, and a rule can compare the metered consumption with the invoiced volume and raise an anomaly when the two differ.
Will our site managers be flooded with anomalies?
Each rule runs with the site's own thresholds and opening hours, so a Sunday opening or a closed day is not mistaken for waste. Each person receives only the anomalies of the sites they are responsible for, and a repeated anomaly escalates to a named person instead of repeating.
Can we start with part of our sites?
Yes. Most multi-site organisations start with one group of sites, often one country or one banner, and roll the same set-up out to the rest once it works: how we work with you.
Get started
See your sites on one screen
In the demo we start from your sites and countries and the obligations you report on, and show the waste, the anomalies and the savings your team would work with.