

Core component · Metrics and KPIs
Any KPI your sector needs
Every dashboard, report, anomaly rule and app in Energis.Cloud is built on metrics. Use the KPIs that come ready, and build your own, without waiting for anyone.
What it brings to your team
One definition for everyone
A KPI means the same on every site and in every report.
Your sector, your KPIs
Formulas, roll-ups and virtual meters, as you need them.
Fair comparisons
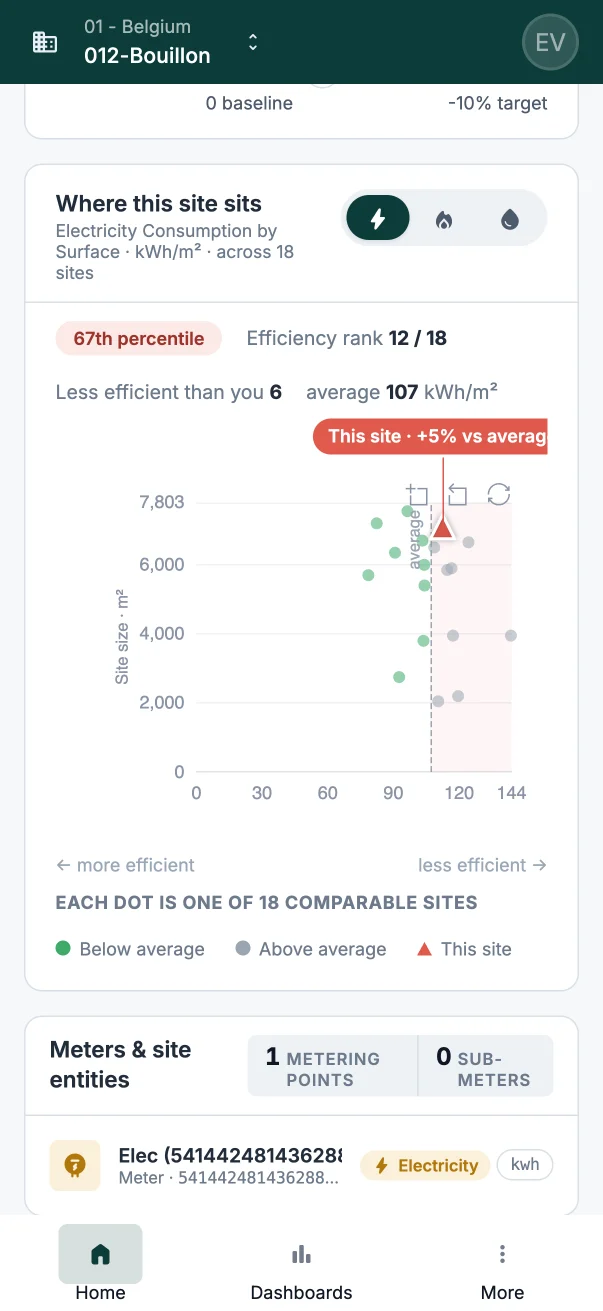
Per m², per opening hour, per degree day.
Yours to extend
SelfCare BUILDER and the Energis Academy show you how.
KPIs for every sector
Energis.Cloud reads 54 kinds of data. These are examples of the KPIs they become, sector by sector.
Retail and offices
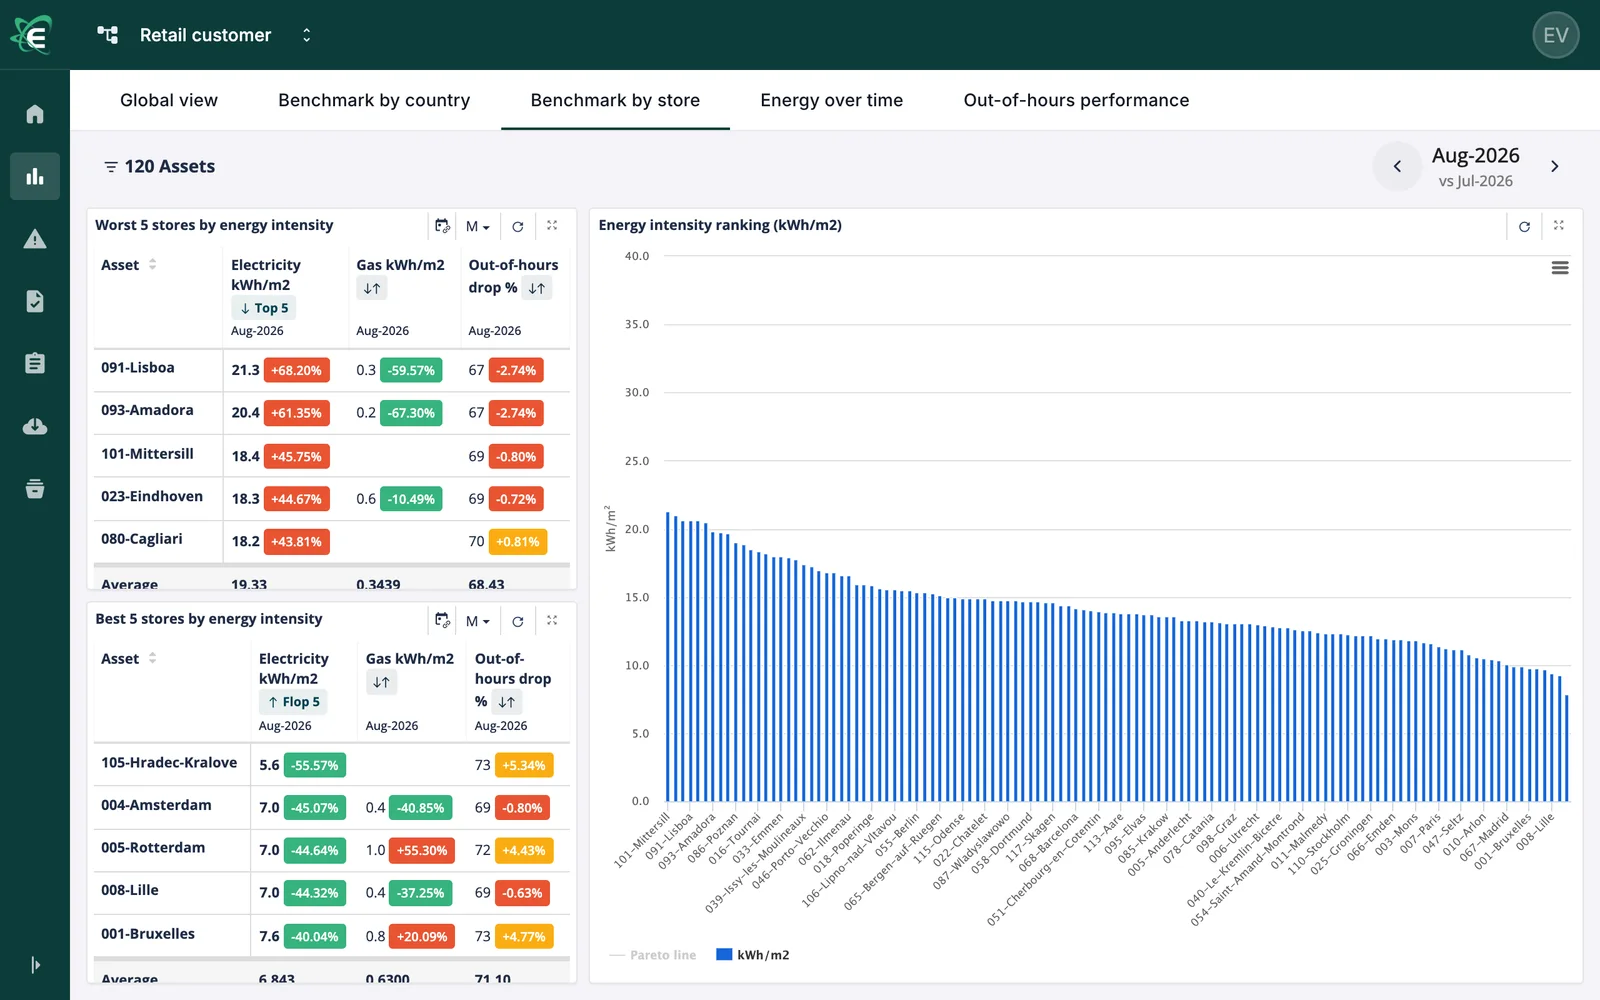
kWh per m², out-of-hours share, cost per site.
Solar
Self-consumption, export, production against expected.
Heating and cooling
Consumption per degree day, weather-normalised.
Power
Peaks against contracted power, reactive energy.
Cost and invoices
Cost per tariff component, supplier and site.
Comfort
CO₂, temperature and humidity against targets.
Operations
Consumption per opening or working hour.
Emissions and waste
CO₂ per site and per energy, waste streams.
Energy KPI guide
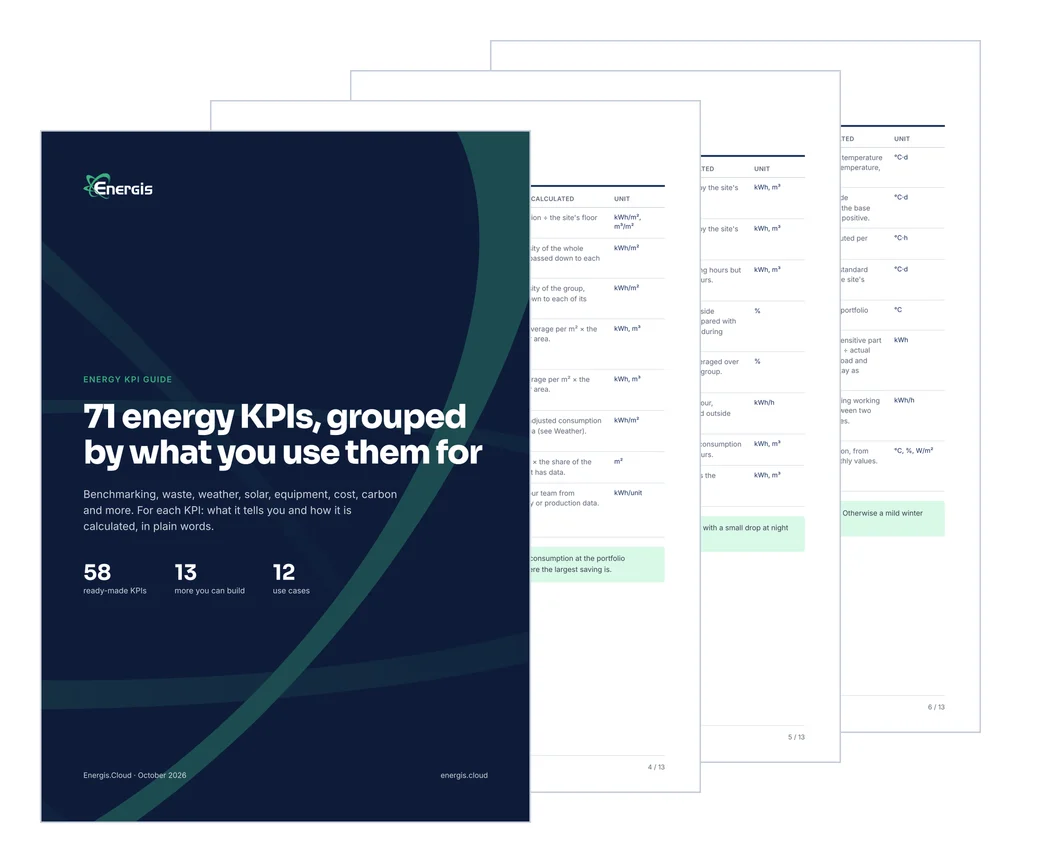
The energy KPI guide: KPIs by use case
Every KPI in this guide, grouped by what you use it for, with what it tells you and how it is calculated, in plain words. Thirteen pages, ready to share with your team.
- Benchmarking, waste, weather and solar
- Equipment, comfort, cost and carbon
- A tip for each use case
We send you the PDF by email. We may contact you about Energis.Cloud; you can unsubscribe at any time.
From a reading to the figure you report
Readings arrive
From meters, sensors, files and invoices.
Metrics are calculated
Formulas, roll-ups, rates and factors.
Templates apply them
The same KPI on every matching site.
Everything uses them
Dashboards, reports, rules and apps.
In use every day
The figures behind thousands of dashboards
Figures as of Across all Energis.Cloud customers.

You can make a lot of correlations with the data so that further improvements are possible.
Read the story
How each team uses it
Energy cost management
Cost per site from every supplier's tariff.
Facility management & ESCOs
Each client's own KPIs, on one platform.
Integrators & engineering offices
Virtual meters and sub-meter roll-ups.
Multi-site energy management
One KPI set compared across every site.
Get started
See your KPIs built from your own data
In a demo we take a site like yours from its meters to the KPIs you report, and show where each number comes from.