

Core component · Orbit
Answers about your portfolio, from its own data
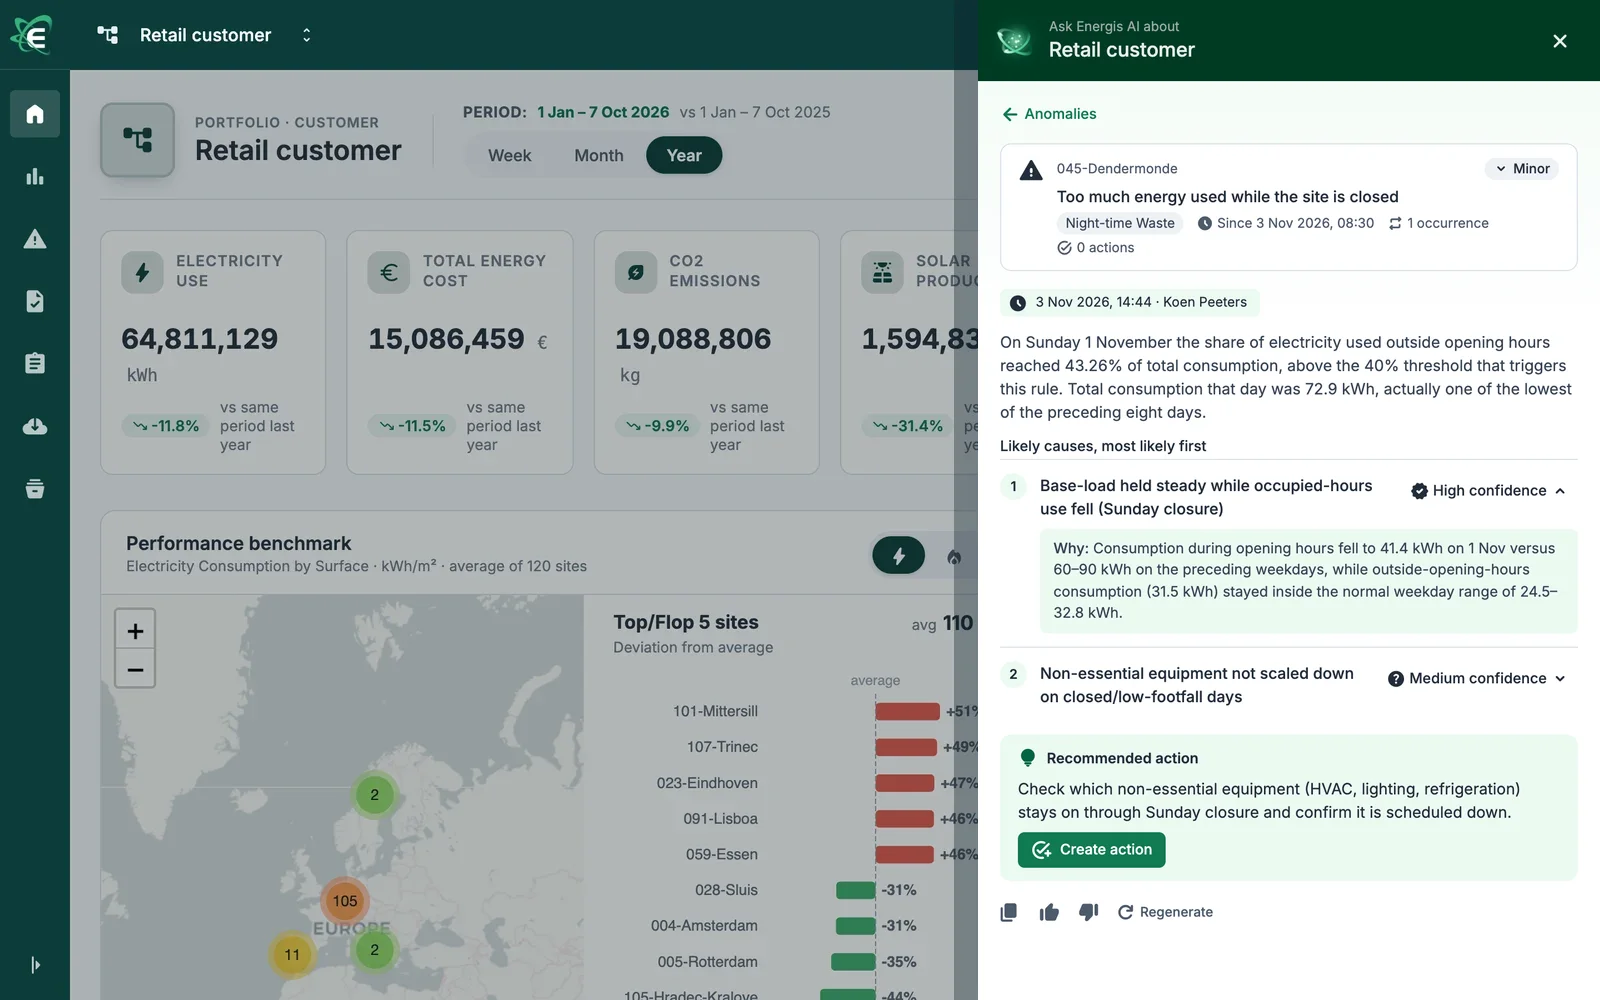
Orbit is the AI in Energis.Cloud. It reads all the platform holds about a site or a portfolio. It gives an overview against last year, shows where you gain and lose, and explains each anomaly with its likely causes and the next step.
What it brings to your team
An overview of any site or portfolio
Consumption, cost, data gaps and anomalies, against last year.
Where you gain and lose
Site by site, the largest gains and losses against last year.
The likely cause of each anomaly
Most likely first, each with a confidence level and why.
Shared with your team
Every analysis is kept, and the next one takes your feedback into account.
Explaining an anomaly, from the data to the next step
Open an anomaly and ask Orbit about it: four steps, the decision stays with your team.
Reads everything in the platform
Data, anomalies, actions, memos, earlier analyses.
Lists the likely causes
Most likely first.
Explains why
Why it thinks so, with a confidence level.
Recommends the next step
Your team decides and creates the action.
Five layers of data beneath every analysis
Each layer is only possible because the one beneath it exists. Orbit reads all of them before it explains an anomaly.
Collection
Every source: connectors, grid operators, building systems, files.
Structure
The equipment, its technical sheet, and which data feeds it.
Calculated metrics
KPIs, formulas and virtual meters, which no raw feed contains.
The people
Notes, comments and actions, written while the building runs.
The analysis
Orbit explains, on top of everything below.
White paper
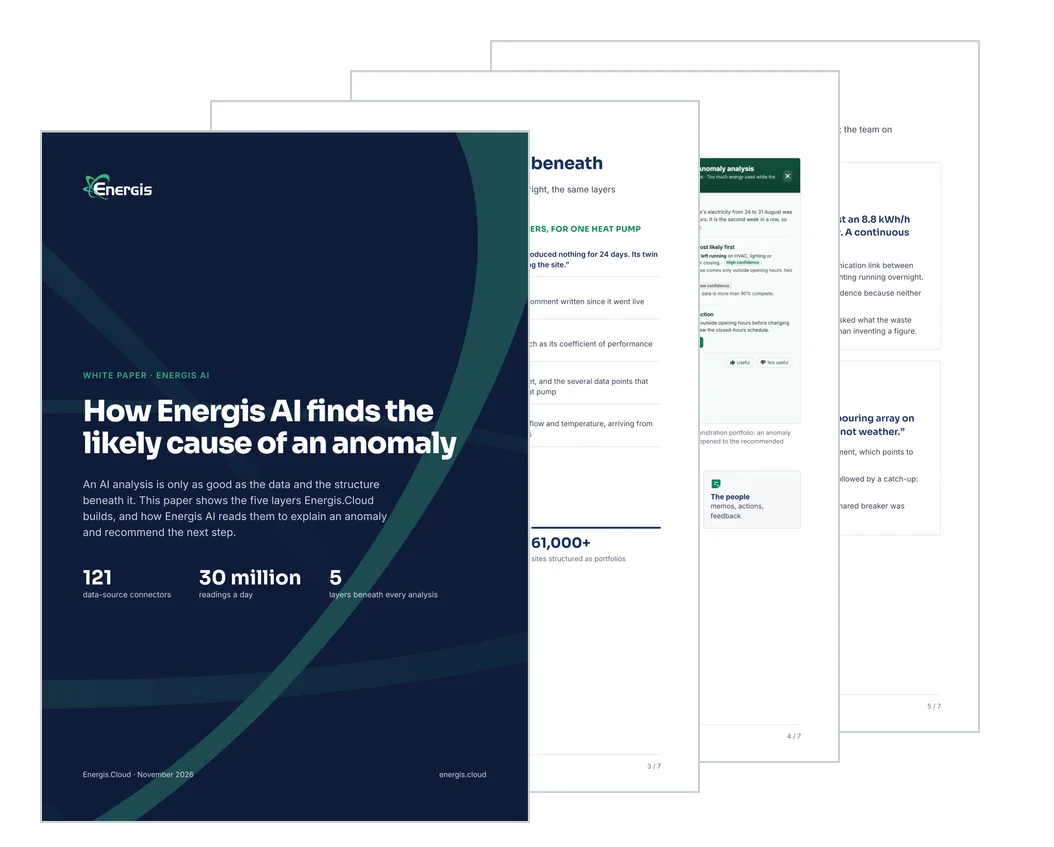
How Orbit finds the likely cause of an anomaly
The five layers Energis.Cloud builds for every site, how Orbit reads them, and two analyses from customers' portfolios. Seven pages to read and pass on.
- Two kinds of AI, and why the data comes first
- The five layers beneath every analysis
- Two real analyses, and what each layer needs
We send you the PDF by email. We may contact you about Energis.Cloud; you can unsubscribe at any time.
In use every day
The data behind every analysis
Figures as of Across all Energis.Cloud customers.
Memos: the notes Orbit readsHow each team uses it
Energy cost management
Where each client gains and loses, against last year.
Facility management & ESCOs
The likely cause behind each client's anomalies.
Integrators & engineering offices
Each likely cause comes with its reason, ready to check on site.
Multi-site energy management
A small team knows where to look first.
Get started
See what Orbit says about a portfolio like yours
In a demo we open a site like yours and show its overview against last year, then an anomaly with its likely causes, the confidence and the reason why, and the next step.