


Pre-built app · Monitoring
Energy Overview
Every site's energy, cost and CO₂, from the portfolio down to the meter.
- Included in the Starter Pack
- Set up with you during onboarding
Formerly Consumption Monitoring
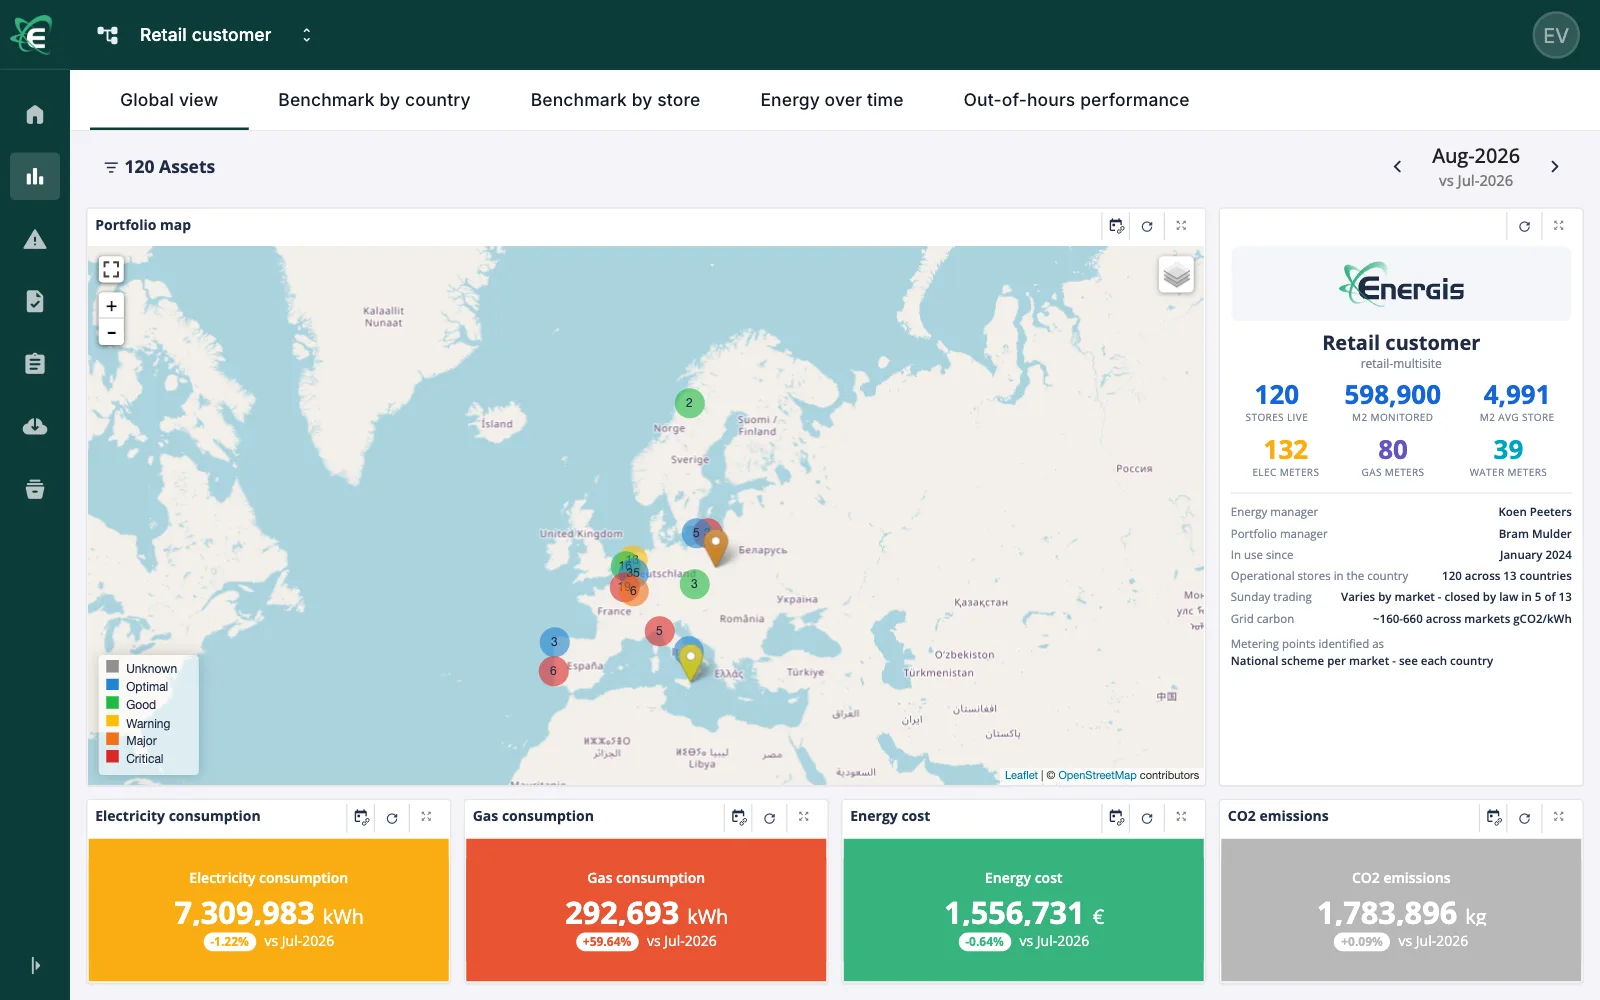
The questions Energy Overview answers
For energy managers of multi-site portfolios, and the site teams they work with.
- How much does each site use and cost, against last year?
- Which sites perform worse than comparable sites?
- Where is energy used while sites are closed?
Energy Overview KPIs
Each one is explained in the energy KPI guide.
Consumption
- Consumption
- Net electricity consumption
- Main meter and sub-meter consumption
- Monthly and yearly consumption
Benchmarking
- Consumption per m²
- Portfolio average per m²
- Consumption at the portfolio average
Waste and out-of-hours use
- Consumption during and outside working hours
- Drop outside working hours
- Baseload
Weather normalisation
- Heating degree days
- Weather-adjusted consumption
Cost and carbon
- Cost
- CO₂ emissions per energy
Data quality
- Data availability
What it is made of
A pre-built app is a set of Energis.Cloud's core components, set up for one job.
Pre-built app Monitoring
Core components 5 of 11
- KPIs
Compare buildings fairly: per m², per opening hour, per degree day.
- Dashboards
One dashboard for every site, shared with each role.
- Reports
One branded PDF per site, sent on schedule.
- Anomaly rules
Rules you write check every site, every day.
- Energy Engagement Portal
Site teams follow their energy on a phone.
Data integration Your own data
Data integrationBehind every component: 121 data-source connectors for any brand, and 30 million readings a day.The other pre-built apps
Monitoring
See every site clearly
Efficiency
Find waste and prove savings
Control
Act on equipment from one place
Get started
See Energy Overview on a portfolio like yours
In a demo, we set up the app on sites like yours and show the questions it answers for your team.