

Core component · Dashboards
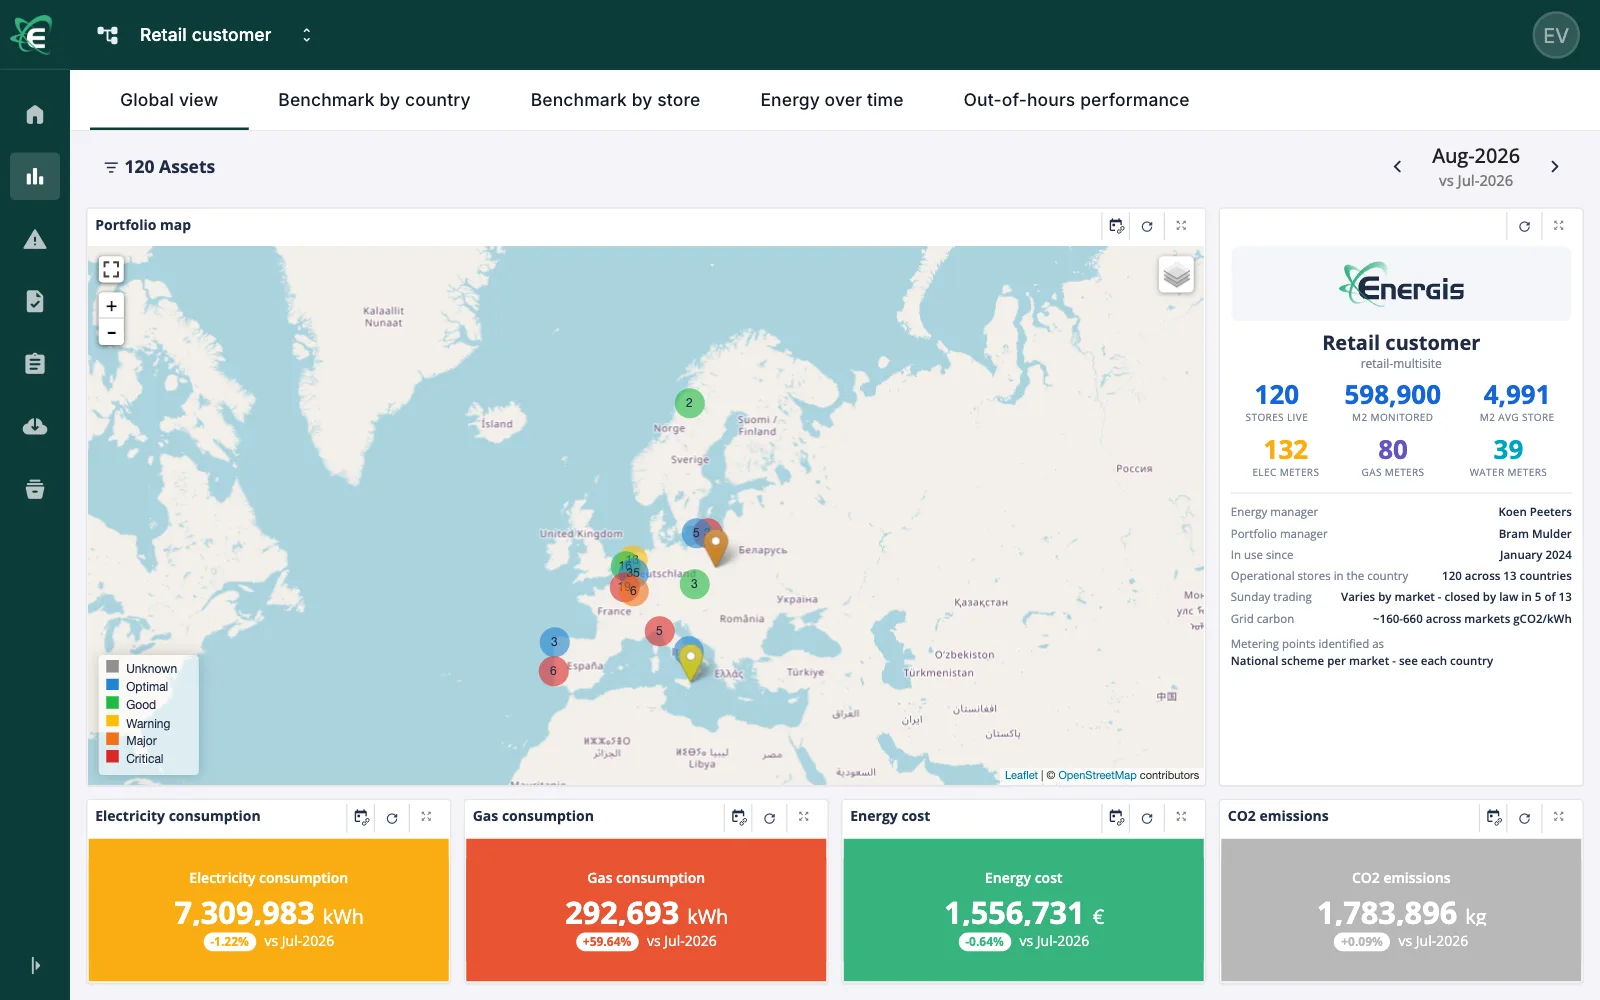
Every site's performance on one screen
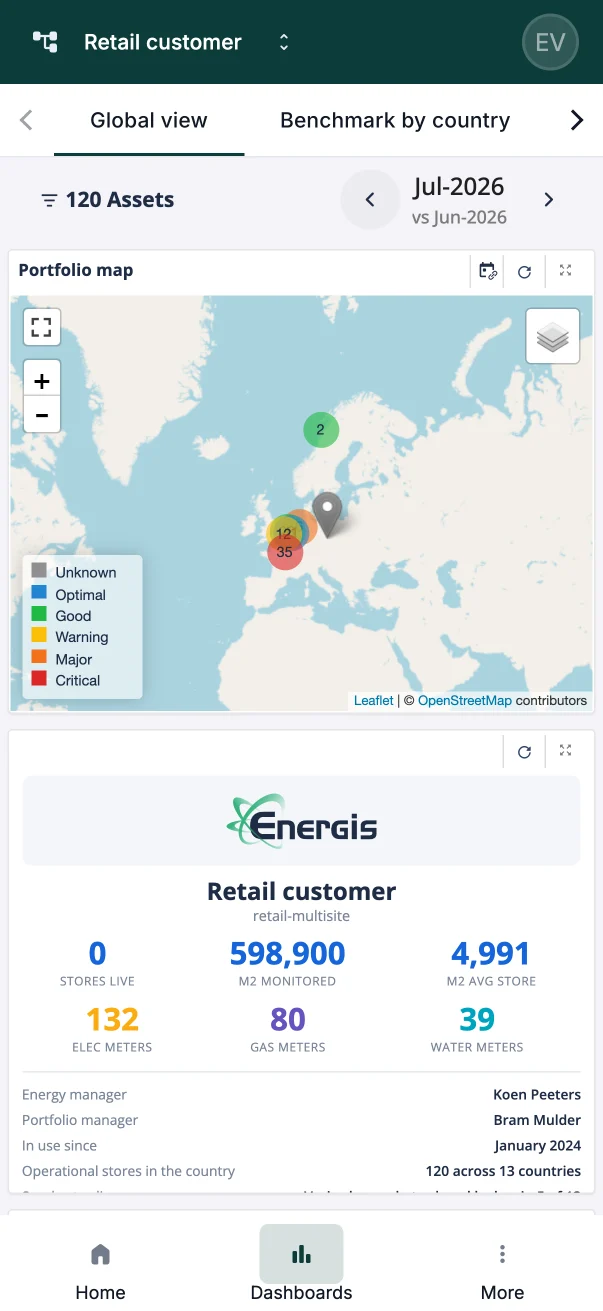
Build a dashboard once and it serves your whole portfolio: every site, every energy type, every person, at a desk or on a phone.
What it brings to your team
Less time on reporting
No more building the same view per site or per client.
Any analysis you need
Cost, CO₂, intensity, comparisons, benchmarks.
The right view per person
Each person sees their own part of the portfolio.
Read anywhere
Clear at a desk and on a phone, nothing to install.
Build once, use everywhere
Build once
Around the questions you are asked.
Every site
The same dashboard opens for each site, new ones too.
Every period
Change the month or the year, and every chart follows.
Always current
The figures update as new data arrives.
In use every day
Dashboards that work for thousands of sites
Figures as of Across all Energis.Cloud customers.

Data is quickly and easily available in dashboards. Measurement is knowledge, so that we can develop new projects, but also control the results of the projects we have implemented.
Read the story
How each team uses it
Energy cost management
Cost per site and per supplier, month by month.
Facility management & ESCOs
One dashboard per client, under your brand with the Custom branding add-on.
Integrators & engineering offices
Data availability for every meter of every client.
Multi-site energy management
Each site manager sees their site; head office sees all.
Get started
See your portfolio on one screen
In a demo we build a dashboard on sites like yours, and open it on a phone as your site manager would.