


Pre-built app · Monitoring
Comfort & Air Quality
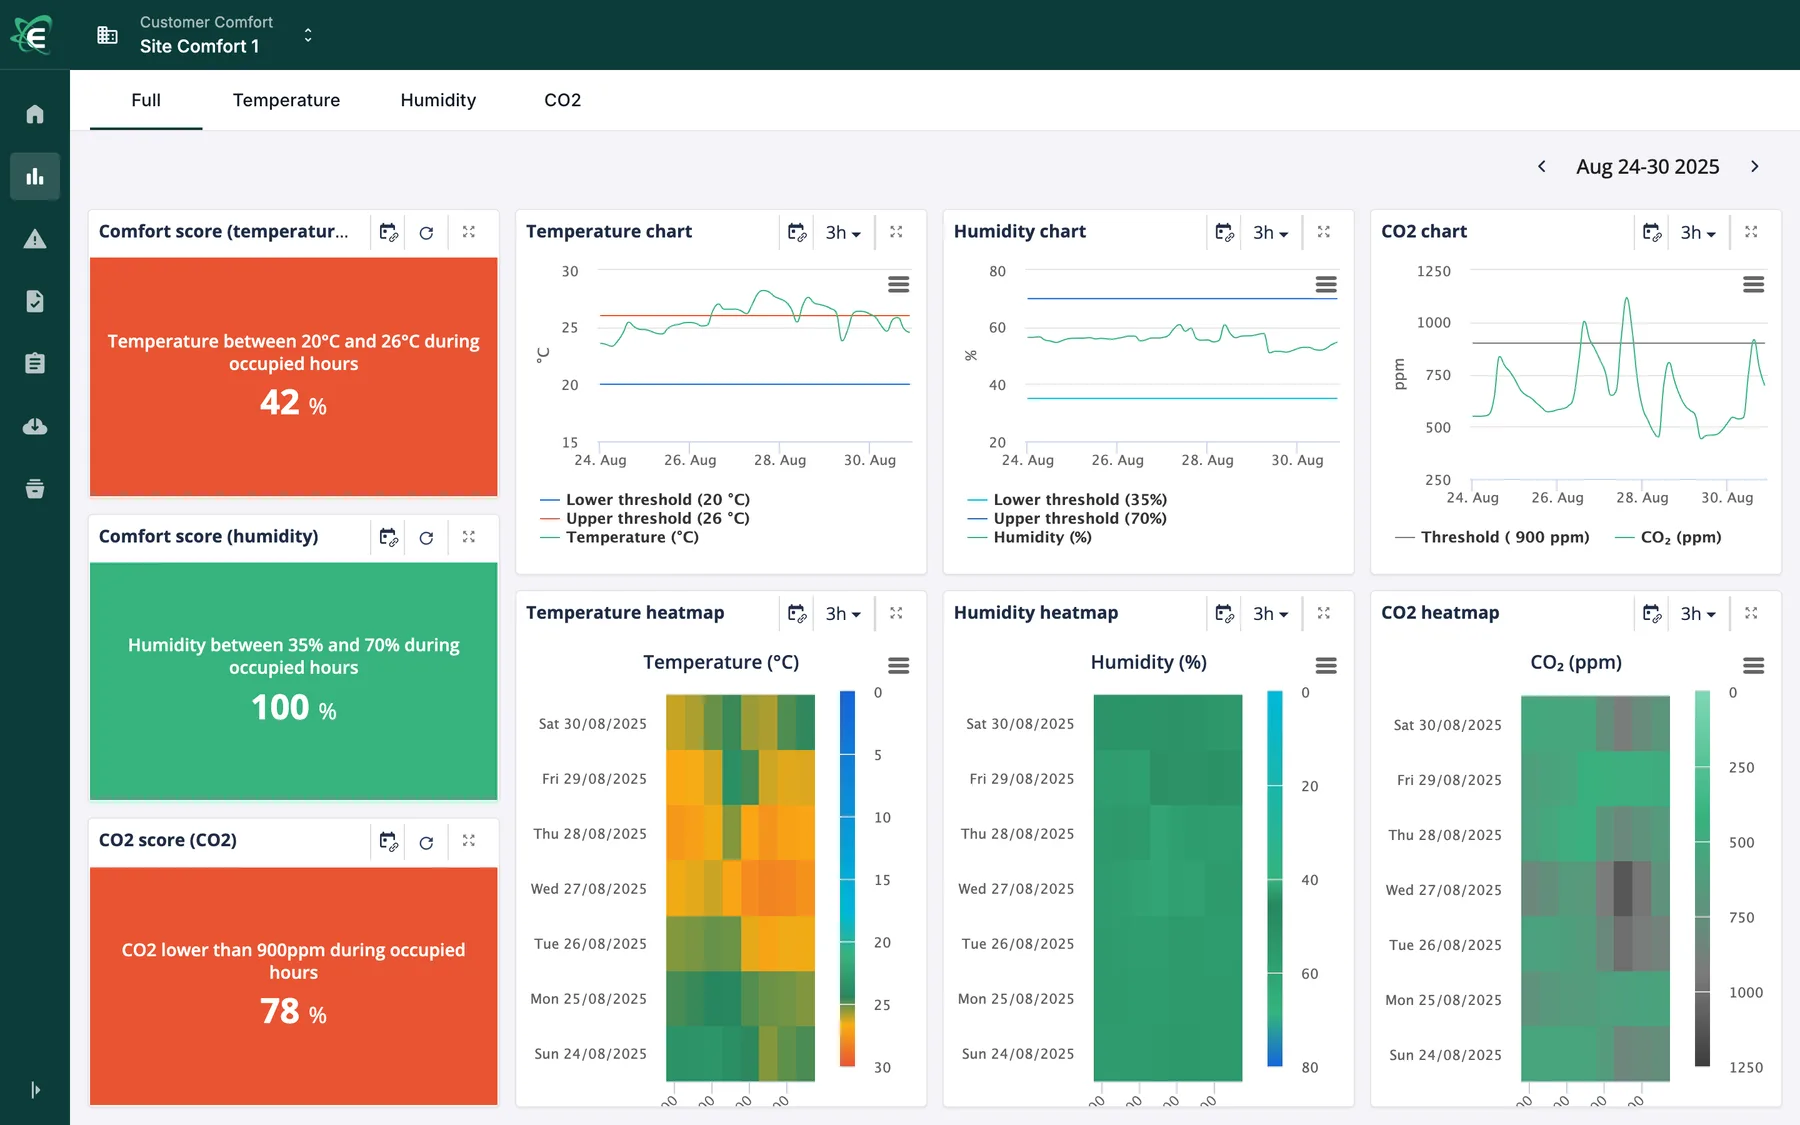
A comfort score for every room, from temperature, humidity and CO₂ while the building is in use.
- Added to the Starter Pack as a module
- Set up with you during onboarding
Formerly Indoor Air Quality & Comfort Monitoring
The questions Comfort & Air Quality answers
For facility teams of offices, schools, care homes and public buildings.
- Are people comfortable when the building is in use?
- Which rooms need more fresh air?
- Do our energy savings come at the cost of comfort?
Comfort & Air Quality KPIs
Each one is explained in the energy KPI guide.
Comfort and indoor climate
- Indoor CO₂
- Indoor temperature and humidity
Operating calendar
- Working hours
Calculated by the app
- Temperature comfort score: share of occupied hours between 20 and 26 °C (default thresholds, adjustable)
- Humidity comfort score: share of occupied hours between 35 and 70 % (default thresholds, adjustable)
- Air quality score: share of occupied hours with CO₂ below 900 ppm (the Belgian workplace limit; adjustable)
What it is made of
A pre-built app is a set of Energis.Cloud's core components, set up for one job.
Pre-built app Monitoring
Core components 4 of 11
- KPIs
Compare buildings fairly: per m², per opening hour, per degree day.
- Dashboards
One dashboard for every site, shared with each role.
- Anomaly rules
Rules you write check every site, every day.
- Reports
One branded PDF per site, sent on schedule.
Data integration Your own data
Data integrationBehind every component: 121 data-source connectors for any brand, and 30 million readings a day.The other pre-built apps
Monitoring
See every site clearly
Efficiency
Find waste and prove savings
Control
Act on equipment from one place
Get started
See Comfort & Air Quality on a portfolio like yours
In a demo, we set up the app on sites like yours and show the questions it answers for your team.