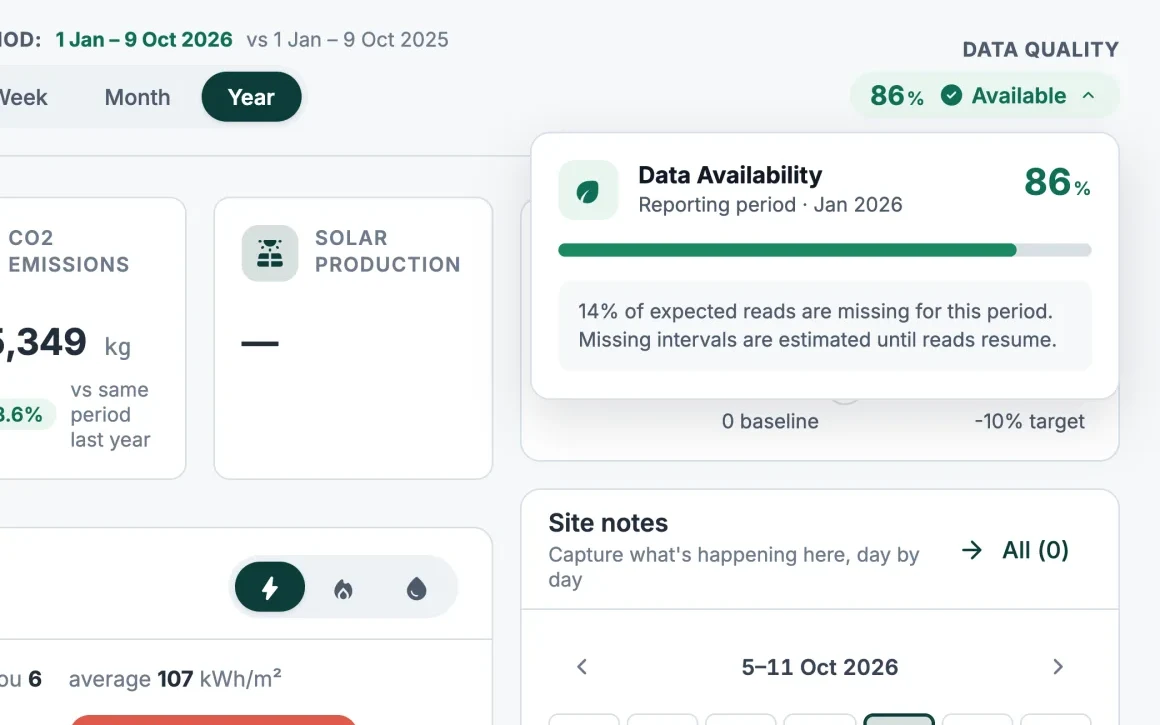


Core component · Data quality
Numbers you can stand behind
Energis.Cloud checks every meter, every day: what arrived, what is missing and what looks wrong, so your reports and KPIs hold up when a client asks.
What it brings to your team
Reports that hold up
Every figure traces back to its readings.
Silent meters found fast
An anomaly the day data stops arriving.
Corrections by your team
Your team corrects a wrong reading itself.
Every change on record
Who changed what, and a way back.
From a raw reading to a figure you can trust
Data arrives
From meters, systems, files and grid operators.
It is checked
Completeness per meter, day by day.
Gaps are flagged
A no-data anomaly is raised when a source goes quiet.
Errors are corrected
Correct one reading or a whole period, and every figure updates.
In use every day
Data checked before anyone reads it
Figures as of Across all Energis.Cloud customers.
Where the data comes fromHow each team uses it
Energy cost management
Invoices checked against complete readings.
Facility management & ESCOs
Client reports that stand up to every question.
Integrators & engineering offices
Every meter of every client watched daily.
Multi-site energy management
One view of which sites can be trusted.
Get started
See your own data, checked
In a demo we look at the completeness of sites like yours, and correct a wrong reading together.