

Integrators & engineering offices
Every meter you install, kept in check
Energis.Cloud is the white-label energy management platform for technical integrators and engineering offices.
- One rule for thousands of meters
- Each client on its own portal
When metering is no longer enough
You install more meters than you can monitor
Every year adds hundreds of meters, and the data arrives dirty: gaps, impossible values, index rollovers, meters replaced mid-history.
On Energis.Cloud
- See every meter that stops sending, before your client does.
- Correct impossible values and roll-overs at the source, with every change on record.
- Keep a meter's history when it is replaced, so the curve stays whole.
One integrator runs about 1,000 meters on Energis.Cloud, sub-metered down to circuit level.
Data quality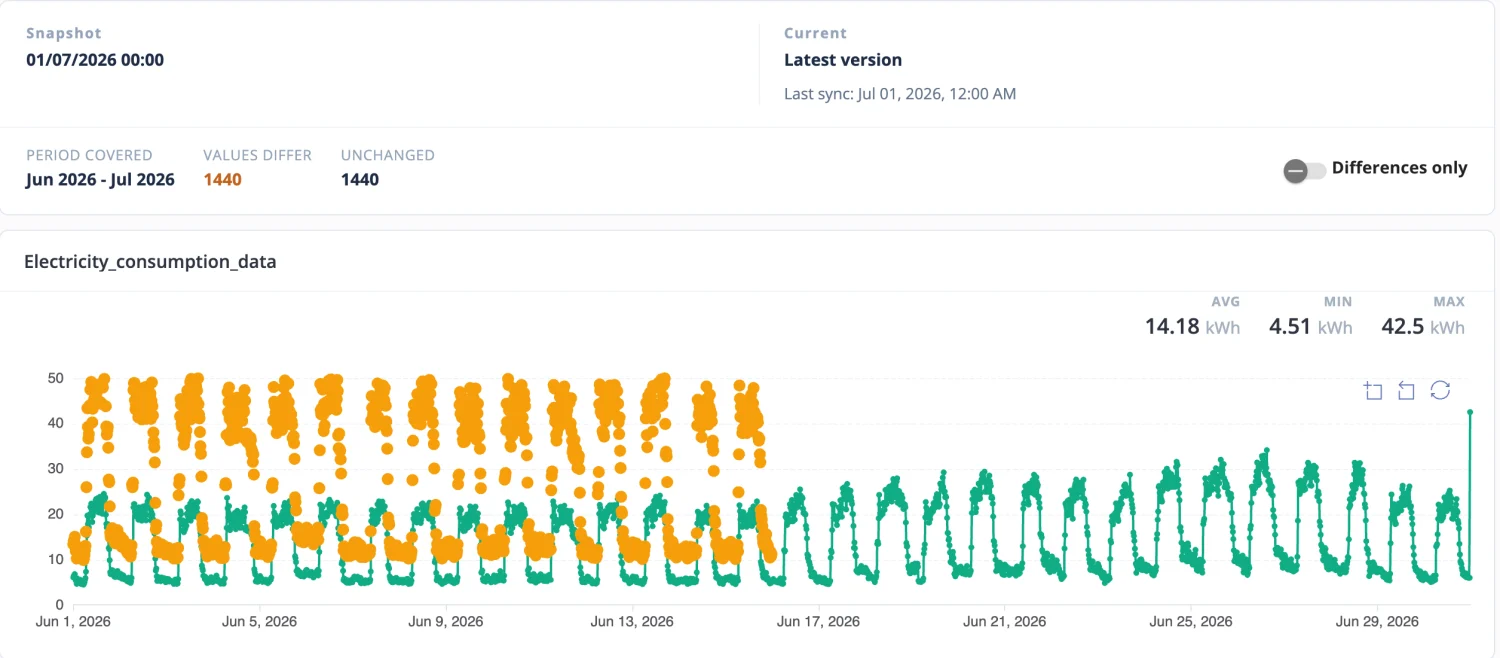
Your installation ends at handover
The job is paid once, and the meters you installed keep sending data that nobody turns into a service.
On Energis.Cloud
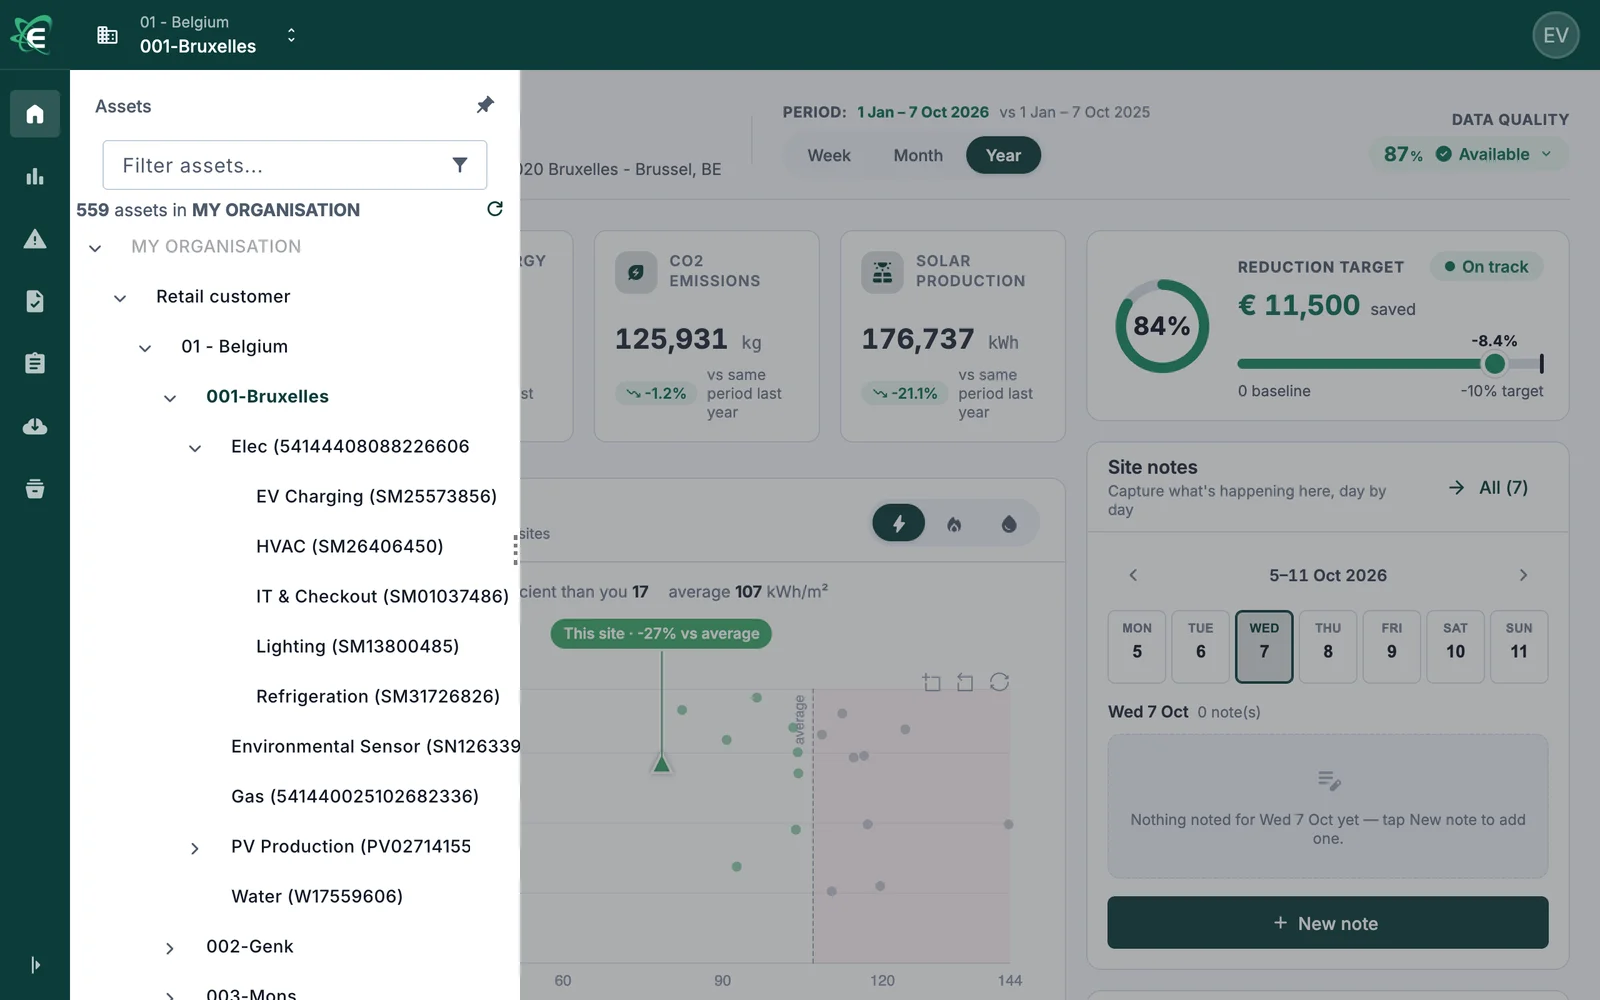
- Give each client its own portal, showing its own sites and nothing else, on your own address (yourcompany.energis.cloud) with the Custom branding add-on.
- Start each client on a ready-made app: Energy Overview, Comfort & Air Quality or Solar Performance.
- Send a monthly report with what changed, and add your engineers' advice.
One monitoring firm has delivered its service under its own brand on Energis.Cloud since 2021.
Pre-built apps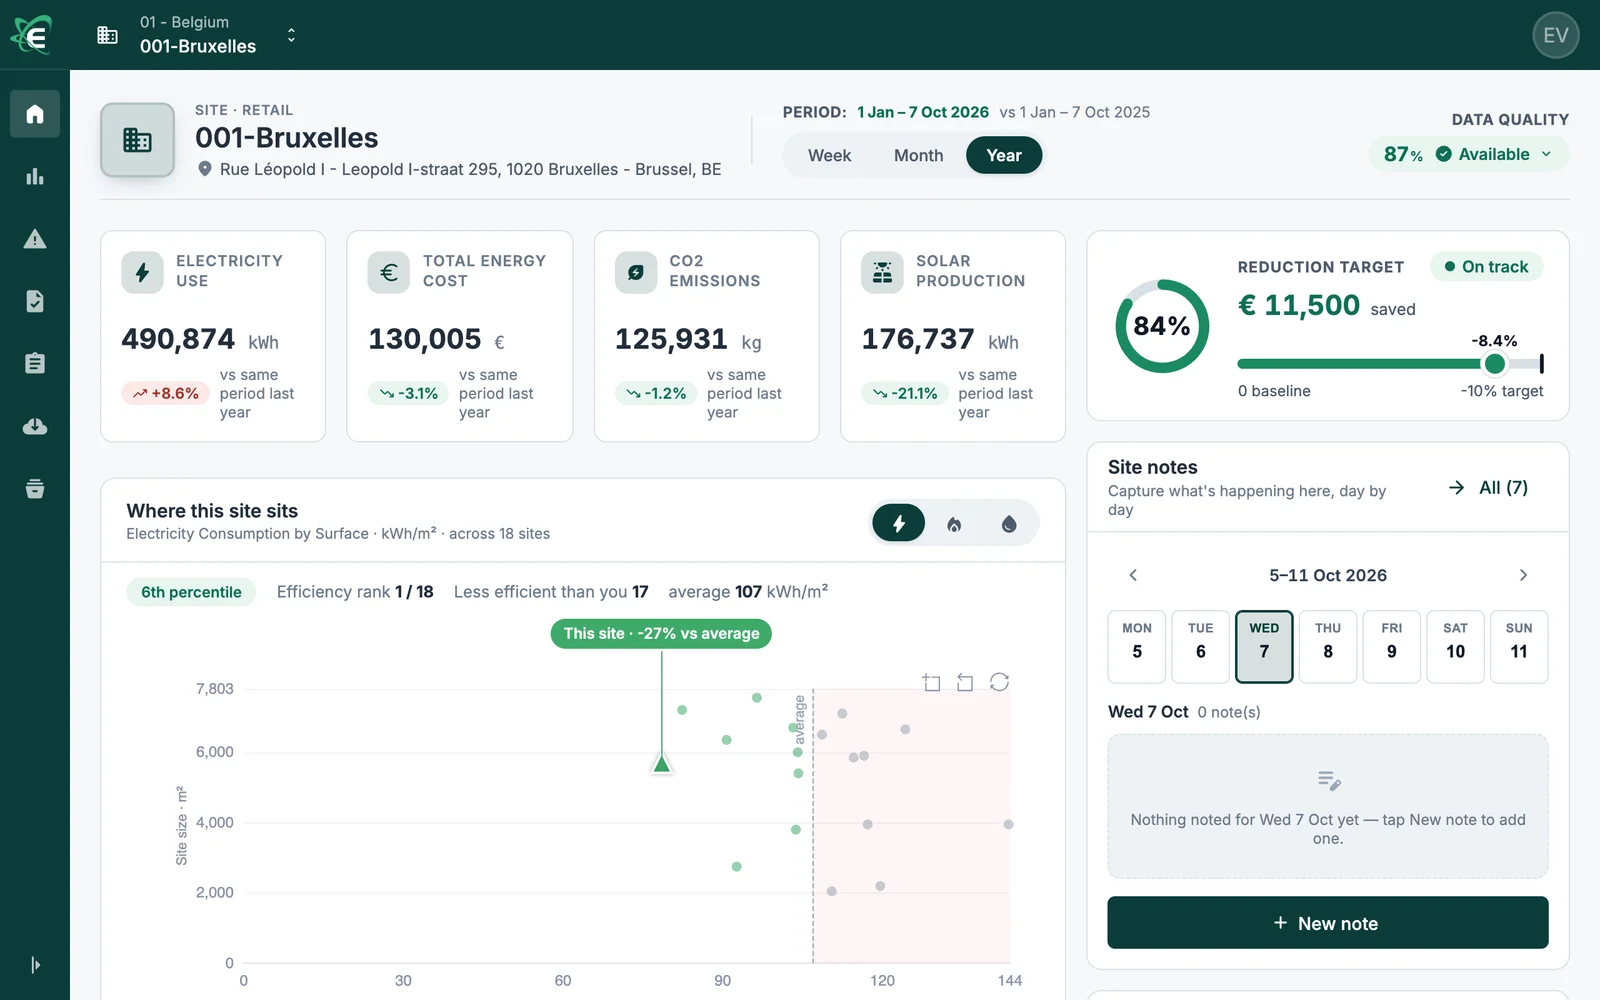
You must prove the installation performs
A heat pump, a solar array or a building system was designed with promised values, and the client wants to see them reached in use.
On Energis.Cloud
- Model each installation as an asset with its own meters, down to the inverter or the circuit.
- Add the KPI that tells its performance, next to its design value.
- Turn a drift into an anomaly with an owner, before the client asks.
An example from the demo portfolio: a solar string producing less than before, found at inverter level.
Metrics and KPIs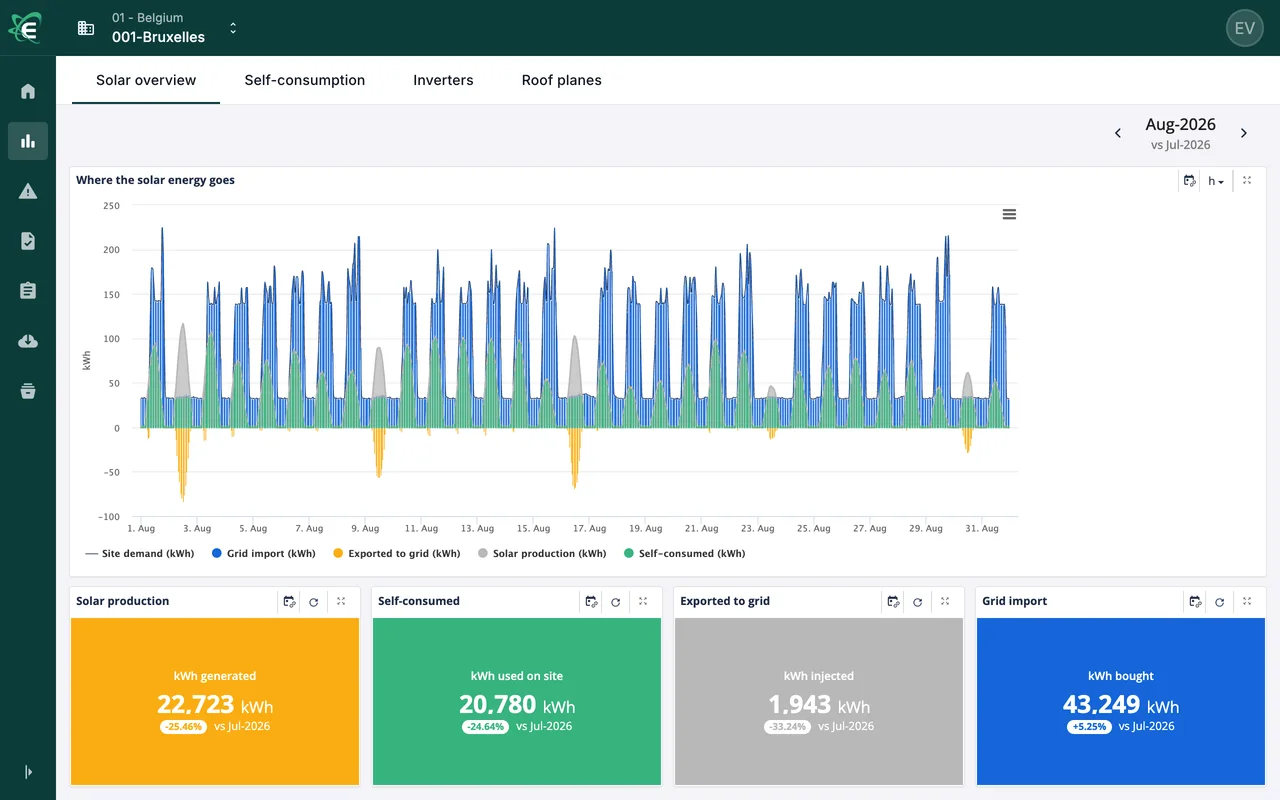
In use every day
The work Energis.Cloud takes off your installation teams' desks
Figures as of A data source is one connected device or feed; a data point is one series of readings, for example the electricity use of one meter. Across all Energis.Cloud customers.
Integrators and engineering offices running their monitoring on Energis.Cloud

Thanks to alarms, we can react quickly to anomalies and take corrective actions in the building. The software allows following the impact of our actions.
- Metiz
Easy to use, very good support, suitable for energy and indoor air quality.
Geert BellensEnergy Engineer and Co-owner, Metiz - Bureau 9000
We need Energis to give well-founded advice on the transition: heat pumps, solar panels, charging points, all of this has to be measured and monitored.
JozefTechnical Adviser, Bureau 9000
The energy services you deliver with the meters you install
Integrators and engineering offices turn the meters they install into a monitored service, client by client: the meters, gateways and building systems sit on one platform, each installation is shown to perform, and every client has its own view.
Monitoring and anomaly follow-up
Every site checked against its own baseline; each deviation becomes an anomaly with an owner.
Energy management as a service
Each client on its own portal, under your brand, with your experts' advice.
Performance contracts and M&V
Savings measured against a weather-adjusted baseline, in line with IPMVP, with the Savings Tracker app.
Comfort and indoor air quality
Temperature, CO₂ and humidity next to energy, with the Comfort & Air Quality app.
Client reporting
One report template per type of client, sent on each client's own dates.
Regulations and certificates
BACS, Décret Tertiaire, EED audits, ISO 50001: the measured data, the KPIs and the record each one relies on.
Maintenance follow-up
Every finding becomes an action with an owner and its saving, shared with the site team.
Invoice checks and budgets
Each invoice compared with what was measured, and budgets set from the same data.
Energy procurement
Consumption aggregated per client, country or contract: the volumes a supply tender asks for.
FAQ
Questions integrators and engineering offices ask us
Which meters, gateways and building systems can we connect?
121 data-source connectors are ready, for grid operators, meters and sensors, gateways and loggers, inverters and building management systems. Any device that sends over HTTP, MQTT, SFTP or email, or a file uploaded through the portal, needs no development. Connecting a new source takes development work, with a lead time and a cost. The full list is in our integrations directory.
What happens when a meter stops sending data?
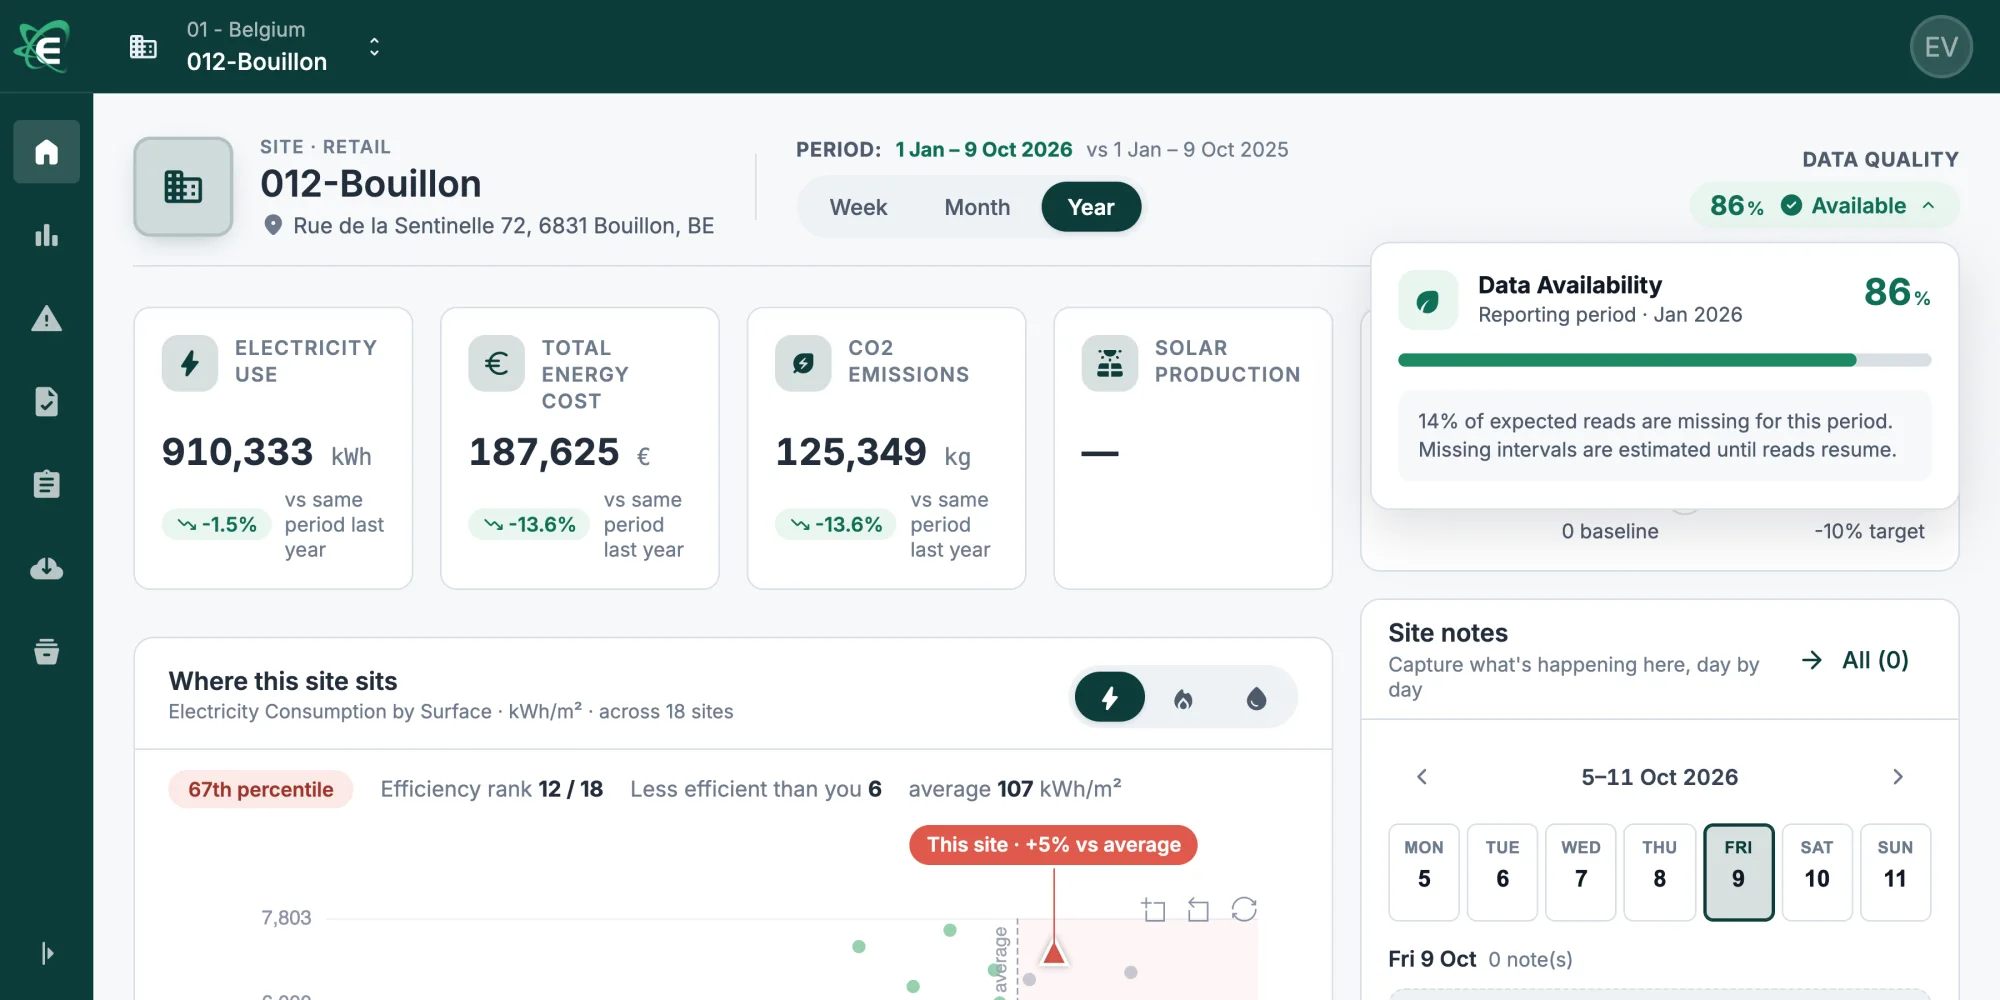
It shows up. The data availability of every meter is measured against the readings expected, and the site page shows it to everyone who works on that site. Missing intervals are estimated until readings resume, an anomaly rule on completeness turns a silent meter into a finding with an owner, and your team can correct a wrong value with every change kept on record.
Can we verify the savings of a performance contract under IPMVP?
Yes, and your engineer stays the one who signs the verification. Energis.Cloud provides the evidence: the Savings Tracker app compares what each installation consumes with a weather-adjusted reference year, in kWh and in euros, and shows how reliable that comparison is with the statistics IPMVP asks for. Read more about IPMVP.
Our clients are used to our portal. Do they have to change?
With the Custom branding add-on, they see your logo and colours on your own address (yourcompany.energis.cloud) and on the reports they receive, with a discreet "powered by Energis.Cloud" in the footer. A domain of your own, such as energy.yourcompany.com, is possible too, with its own pricing and contract terms.
Get started
Bring one metering project to the demo
Tell us which meters and gateways you install and what your clients receive today. We show the fleet, the data quality and the client view on Energis.Cloud.