

Executive Summary
The Energis.Cloud Consumption Monitoring Application industrializes energy governance for multi-site portfolios, where fragmented data silos typically stall sustainability efforts. Acting as a centralized Command Center, it standardizes the workflow—moving from automated anomaly detection to verified operational improvements. In this article, we provide a deep-dive into the technical architecture, high-fidelity KPIs, and operational workflows that transform energy management from a reactive task into a scalable, strategic enterprise function.
The Complexity Wall: Why Traditional Energy Management Fails at Scale
In a small-scale environment, energy monitoring remains a straightforward operational exercise. However, as a portfolio scales beyond the 50-site threshold, energy management undergoes a phase transition from a technical challenge to an organizational crisis.
At this scale, the “Complexity Wall” emerges. Data resides in silos—fragmented across different utility providers, incompatible Building Management Systems (BMS), and manual spreadsheets. The result is a lack of visibility that hides massive operational inefficiencies. Facility managers are overwhelmed by “alarm fatigue,” while C-suite executives set ambitious Net-Zero and ESG targets without a centralized mechanism to track, validate, or catalyze progress.
To bridge this gap, organizations must move beyond passive monitoring. They require a Multi-Site Consumption Monitoring Application designed to industrialize energy efficiency across the entire asset lifecycle.
The Solution: A Centralized Intelligence Hub for Distributed Portfolios
Most modern enterprises have defined rigorous sustainability goals. Yet, there remains a profound disconnect between corporate strategy and site-level reality.
The Energis Multi-Site Consumption Monitoring Application serves as the Single Source of Truth. It transforms raw data into a structured intelligence layer, providing the centralized space necessary to track initiatives and guide decentralized teams toward unified consumption reduction targets. It is no longer about simply “seeing” data; it is about orchestrating performance.
Inside the Application
The Energis platform is built on four technical pillars that allow it to scale without compromising on granularity or performance.
1. The Centralised Data & Universal Metric Catalogue
The foundation of the application is an industry-standard metric catalogue. It is designed to ingest and normalize any energy-related data point, regardless of the source.
- Data Agnostic Integration: Whether via IoT sensors, API-linked utility meters, BMS exports, or manual entries, the platform eliminates data friction, ensuring a seamless flow of information regardless of the hardware landscape.
- Best-Practice KPIs: Technical teams gain immediate access to gold-standard metrics, providing the high-fidelity visibility required for industrial-grade energy management:
- Primary Energy Vectors: Full tracking of Electricity, Natural Gas, Water, and Thermal energy.
- Weather Data Integration: Real-time synchronization with Heating Degree Days (HDD) and Cooling Degree Days (CDD) to allow for climatic normalization.
- Industrial Standard KPIs:
- Energy Intensity: Consumption normalized by surface area (kWh/m²).
- Activity-Based Metrics: Consumption normalized by production or occupancy units (e.g., kWh/unit).
- Baseload: The minimum power demand recorded during non-operational hours.
- Peak Demand: The maximum power draw (kW) recorded within a specific interval.
- Carbon Footprint: Automated conversion of energy consumption into CO2 equivalent emissions.
2. High-Performance Dashboards and Use-Cases
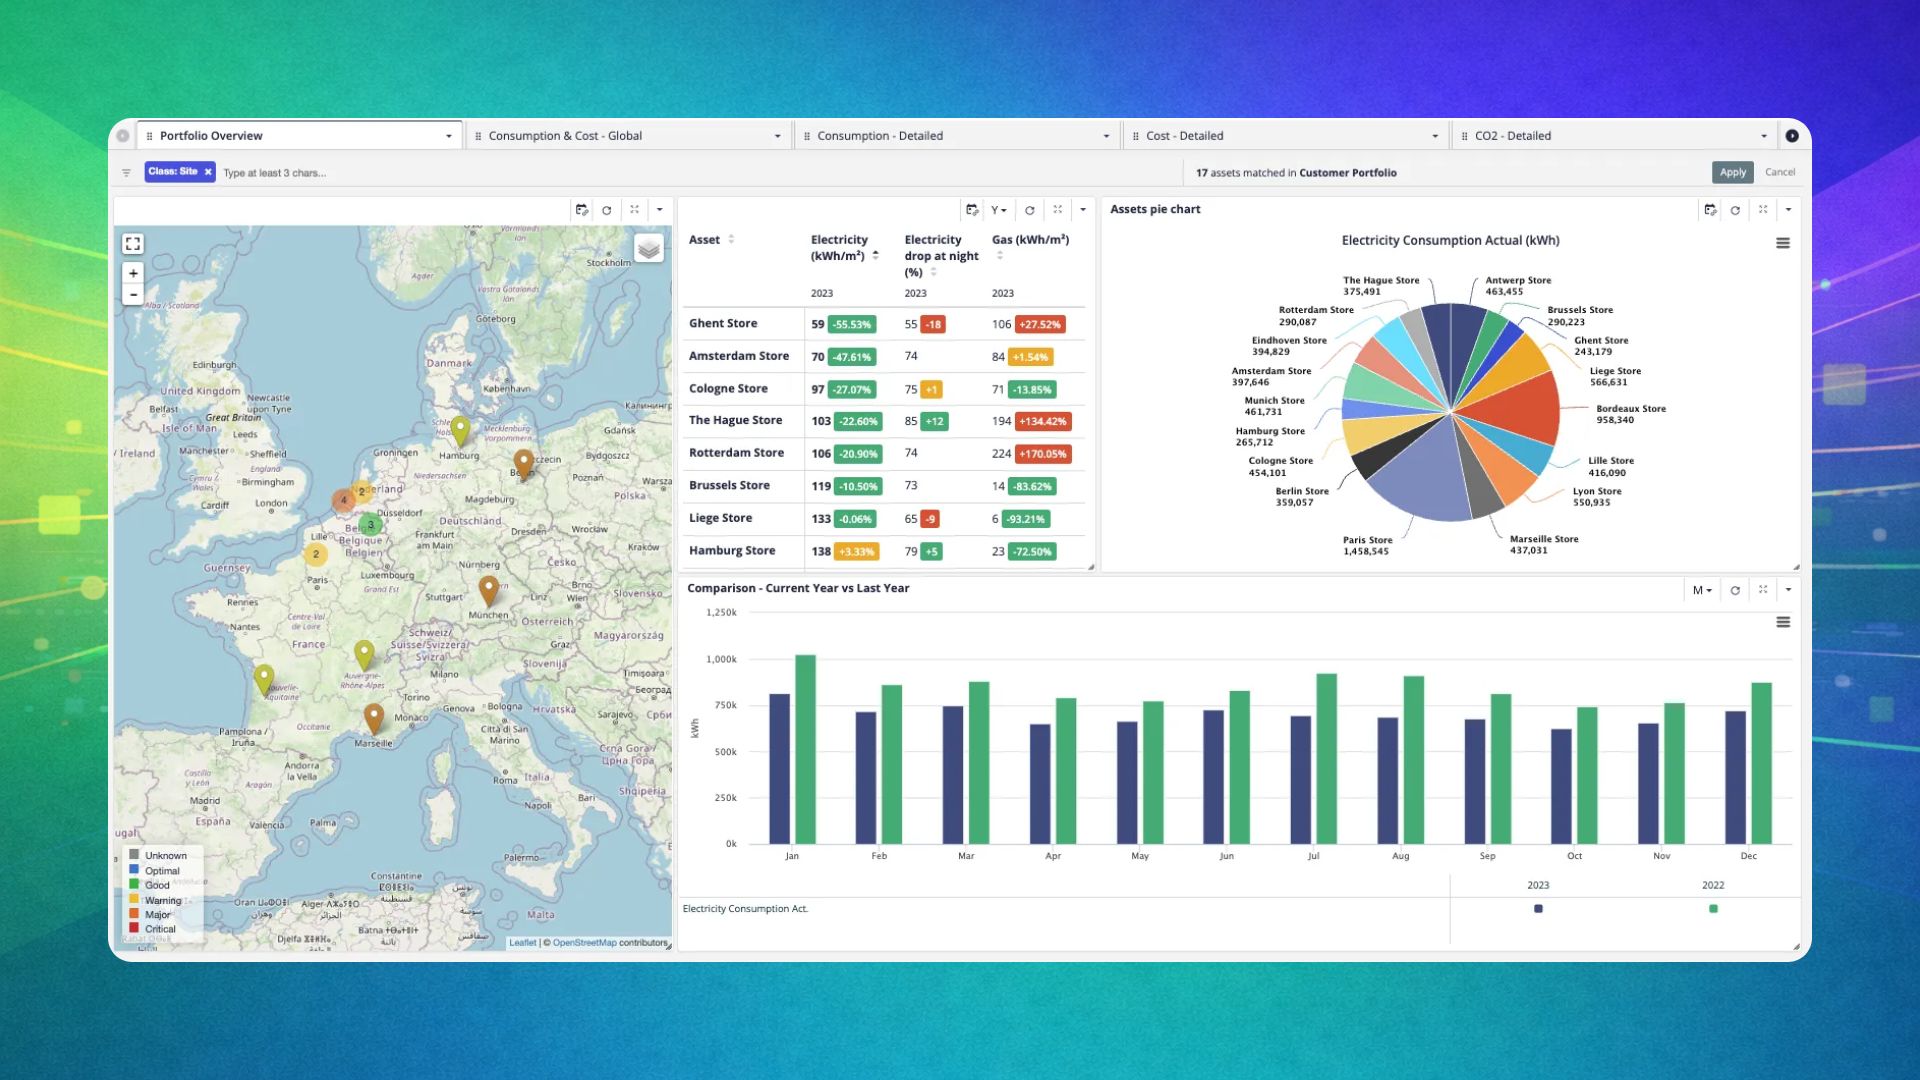
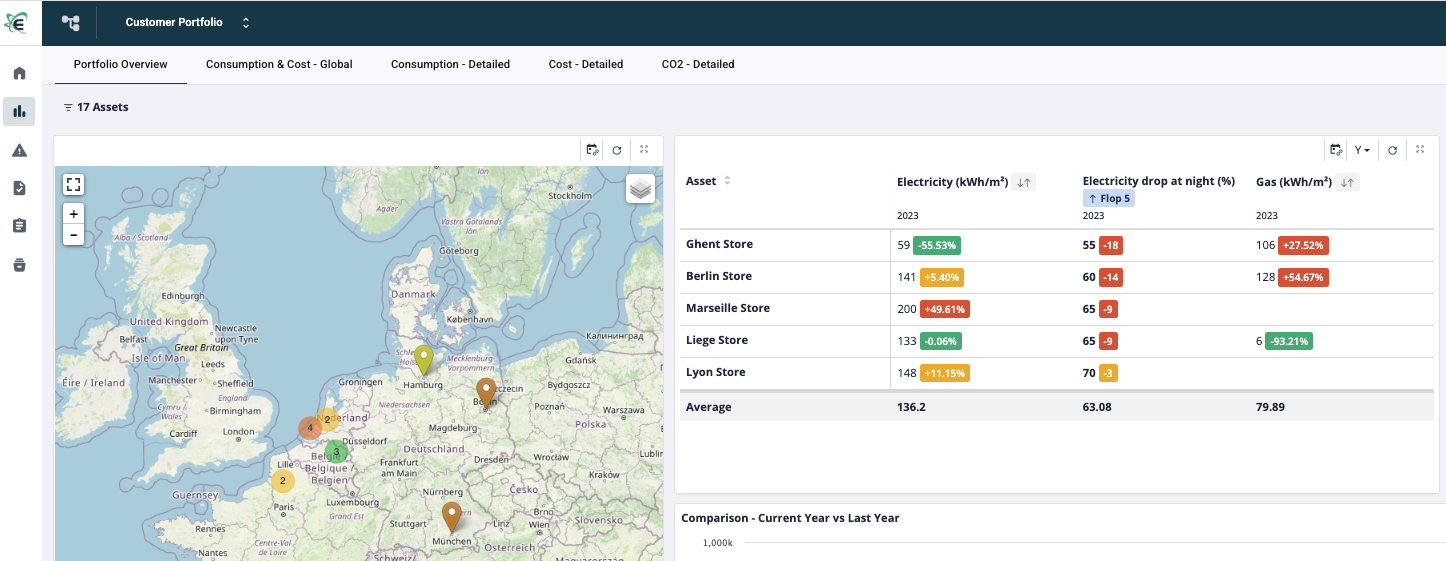
- Portfolio Ranking: Automatically identify the “Bottom 10%” performers across 500+ sites to prioritize capital expenditure (CapEx) and maintenance interventions.
2. Climate-Normalized Performance (HDD/CDD): Utilize Heating and Cooling Degree Days to strip away “weather noise.” This ensures that a spike in consumption is identified as an operational failure rather than just a cold snap, allowing for a scientifically fair comparison between sites in different micro-climates.

3. Load Curve Analysis: Visualize the “pulse” of a building to detect unauthorized overnight consumption or early equipment start-ups.
4. Peak Demand Shaving: Identify the exact timestamps of peak loads to redefine operational schedules and reduce “Power Demand” penalties.

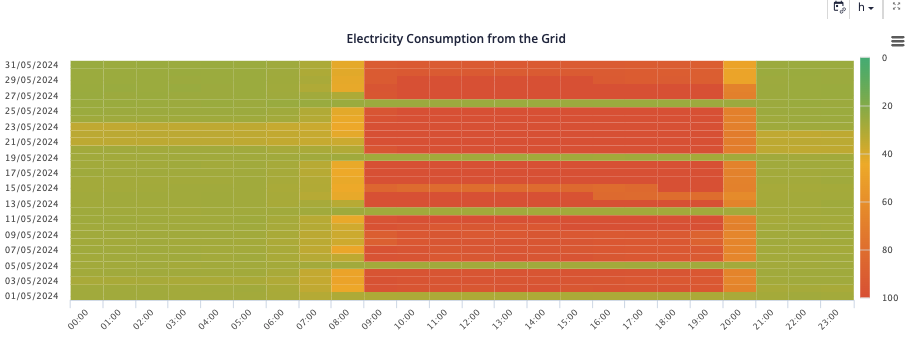
5. Heatmap Visualization: Displays energy intensity across a 24/7 grid. It allows managers to instantly spot temporal patterns of waste, such as equipment starting too early or running too late.
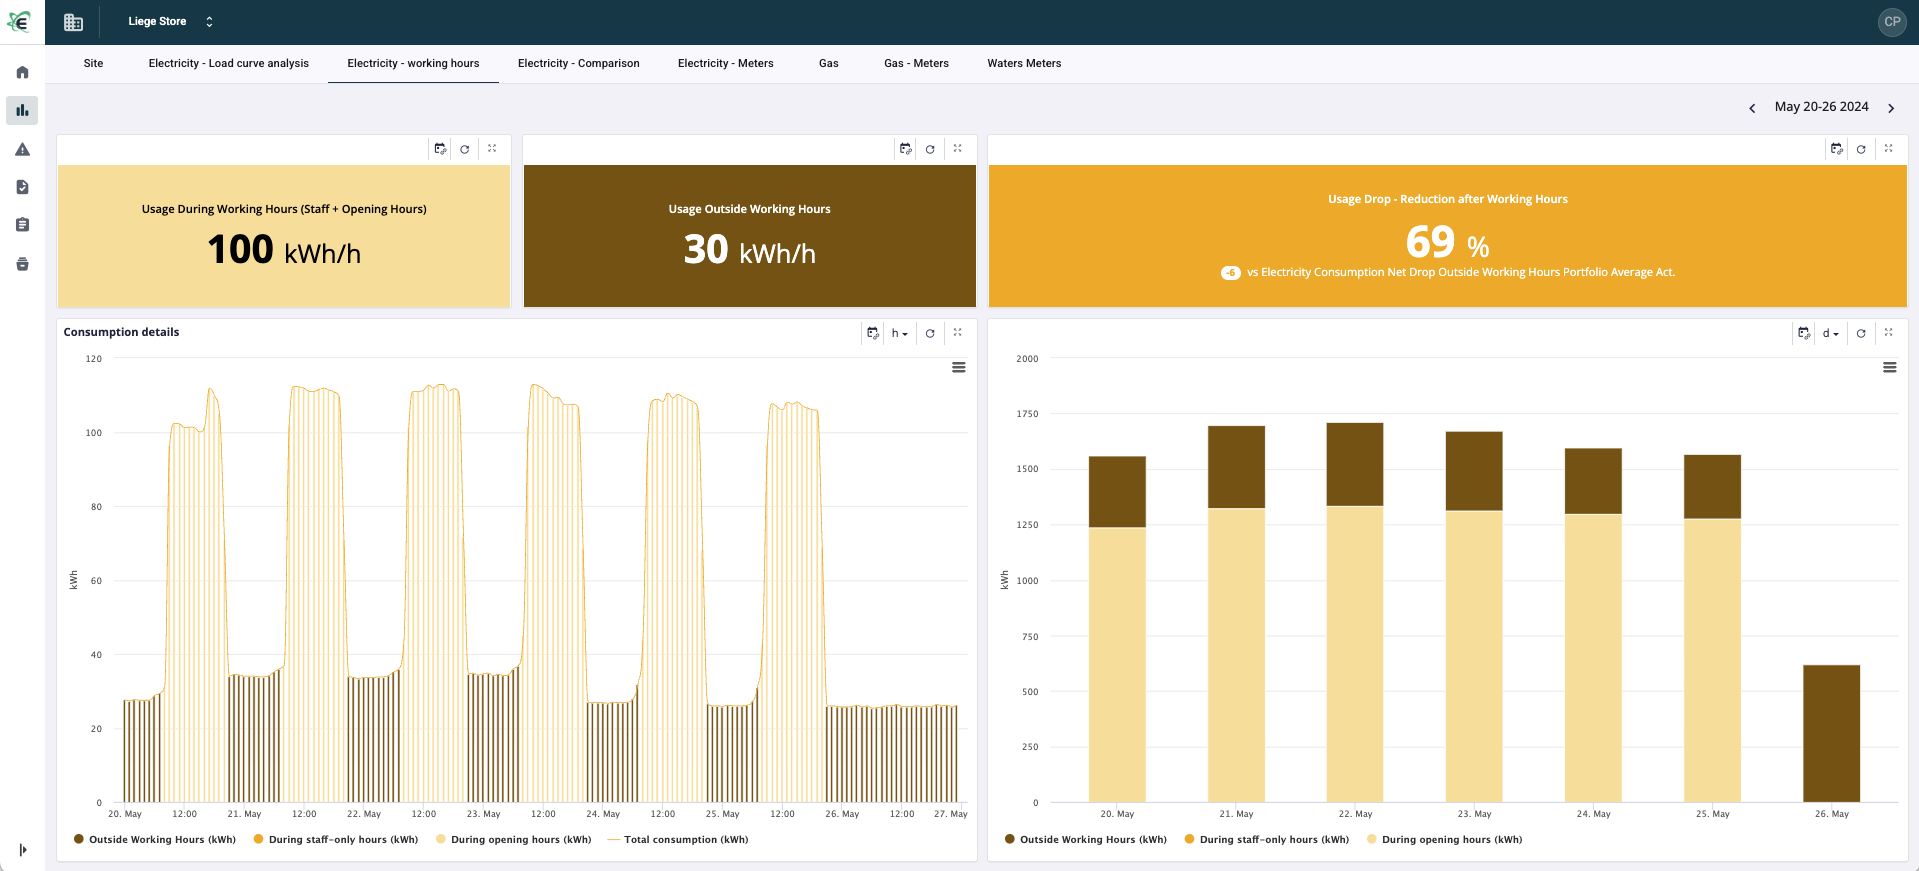
6. Baseload & Non-Operational Drift: Isolate the “standing load” of each facility. By quantifying the energy consumed when the site is closed, the system identifies “silent waste” such as failed lighting sensors, redundant HVAC schedules, or equipment left in standby mode.
7. Operational Alignment (Occupancy vs. Energy): Overlay energy consumption with occupancy data or production logs. This detects “Ghost Consumption”—situations where energy intensity remains high despite low footfall or zero production output—enabling precision-tuned scheduling.
8. End-Use Breakdown & Sub-metering Granularity: Orchestrate a “top-down” to “bottom-up” analysis. By integrating sub-metering data, the system breaks down site-level consumption into specific functional categories—such as HVAC, lighting, or electric vehicle charging stations—identifying exactly which subsystem is driving portfolio-wide waste.
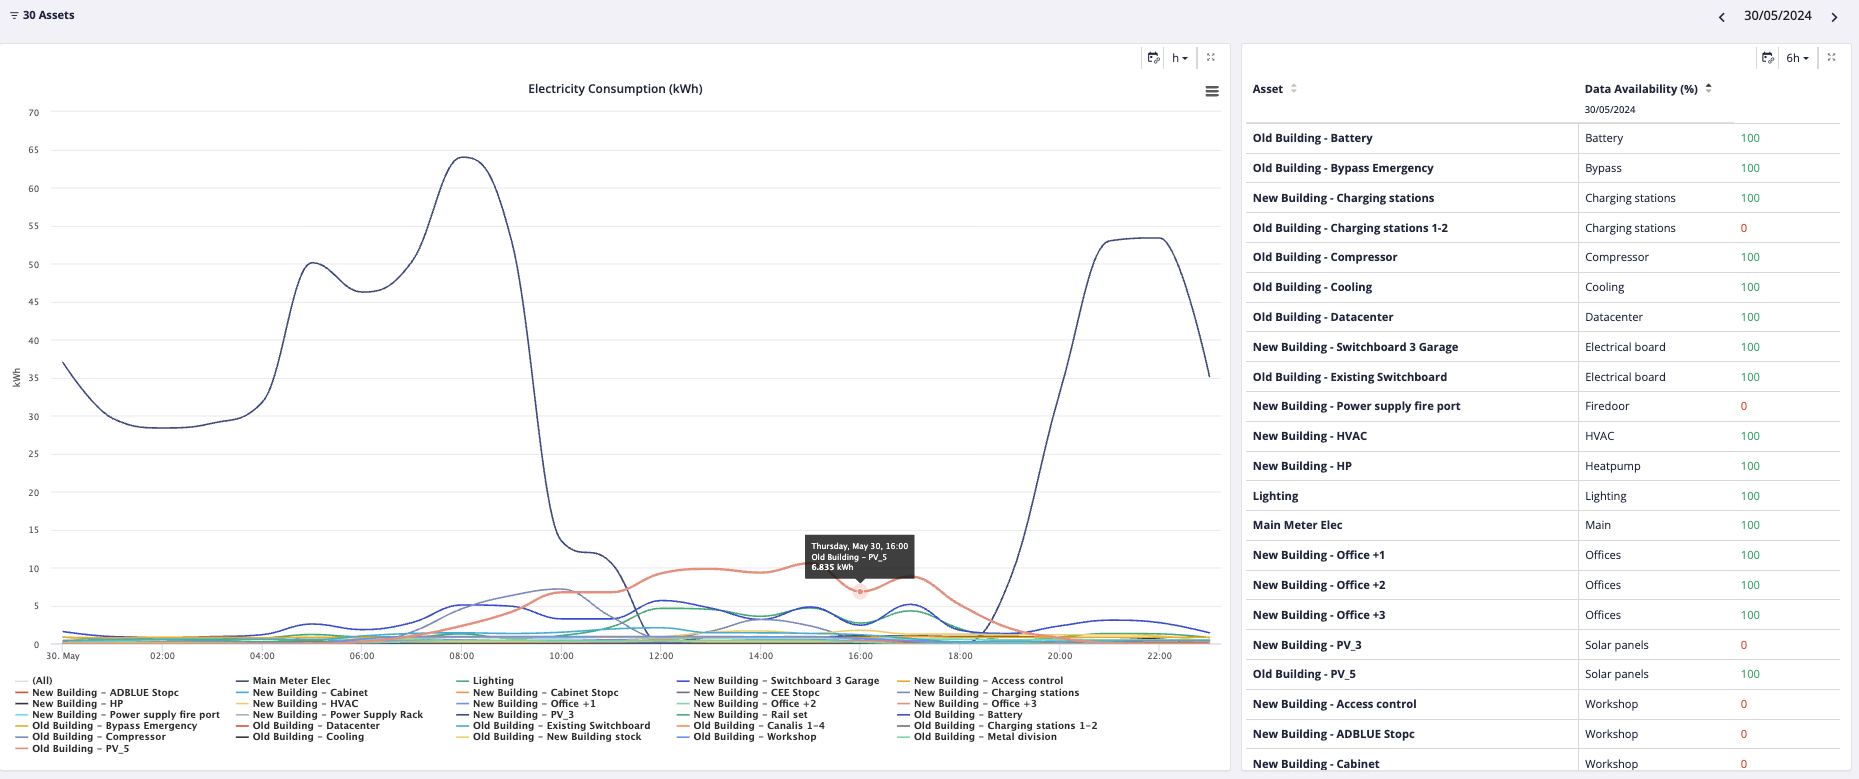
9. Similar Period Comparison: Overlays consumption data from two different time periods (e.g., this week vs. last week). This is the primary tool for verifying the impact of energy-saving actions or detecting sudden drifts in performance.
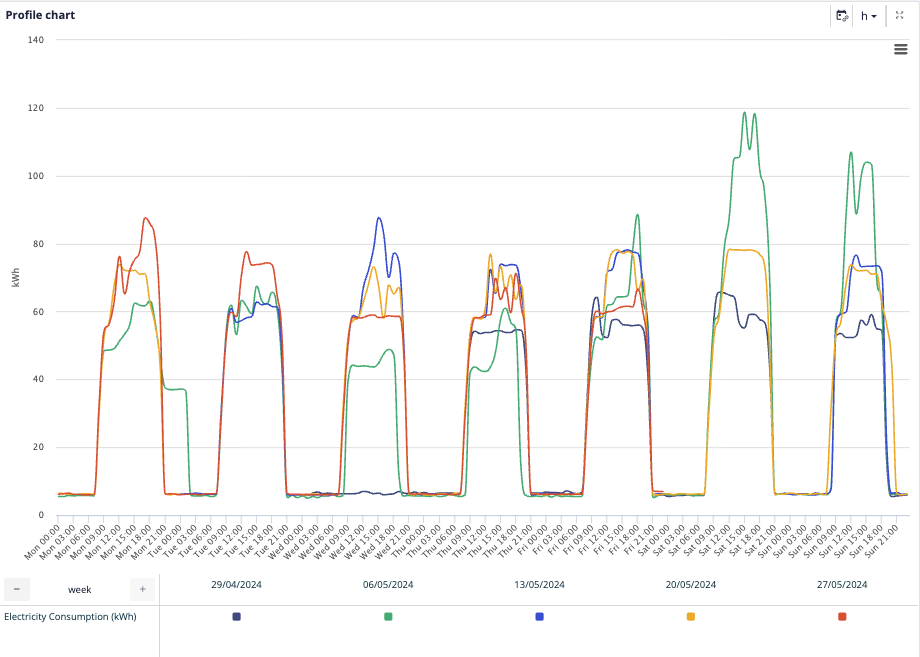
10. Regression Analysis & Target Follow-up: Establish a dynamic relationship between consumption and activity drivers (e.g., production volume, occupancy, or square footage). This ensures that energy targets are not static but are adjusted for operational reality, providing a “Target vs. Actual” visualization that highlights sites failing to meet their efficiency potential.
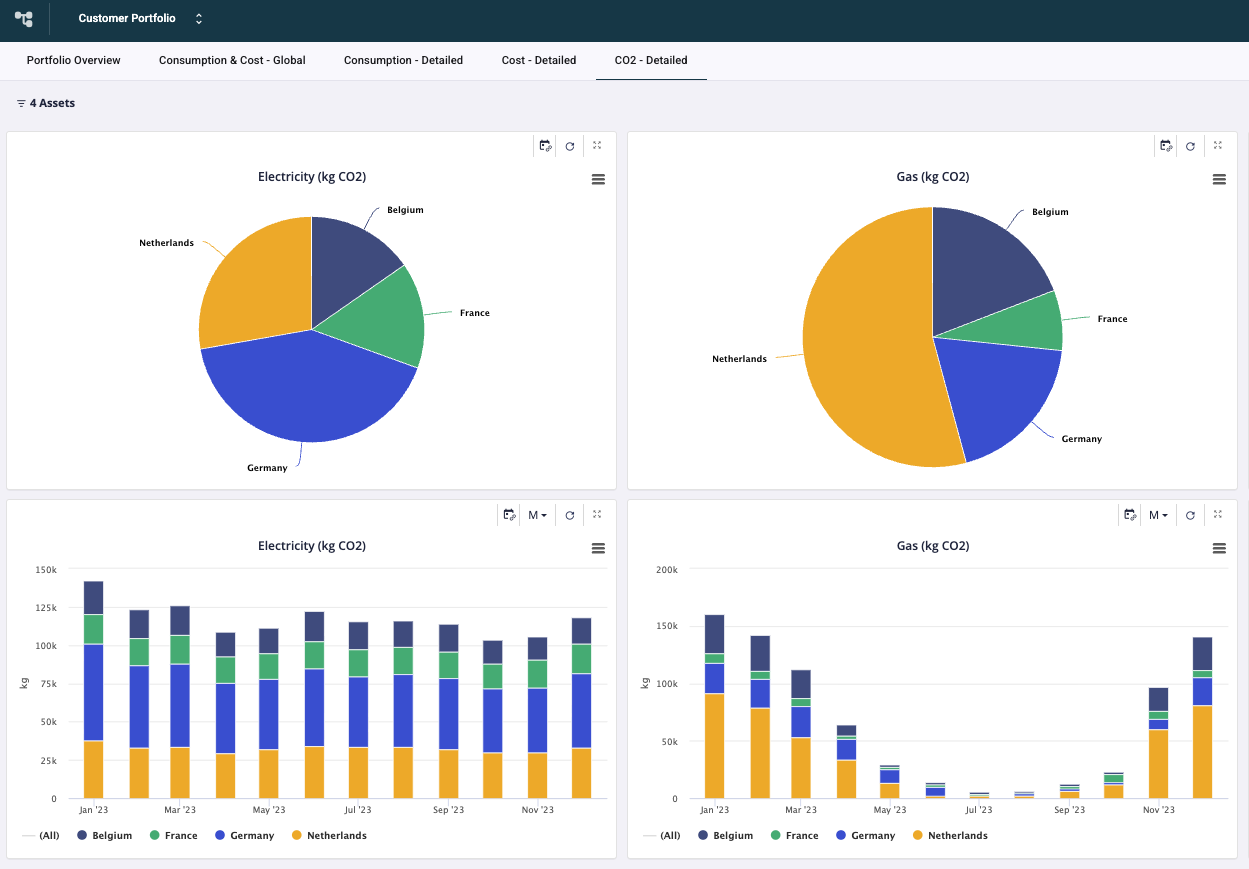
11. Carbon Footprint & ESG Monetization: Automatically translate kWh and m3 into CO2 equivalents based on localized carbon intensity factors. This moves energy data from the boiler room to the boardroom, providing the audit-ready metrics required for global ESG compliance and carbon tax mitigation.
3. The Energy Engagement Portal: Making Performance Visible to Everyone
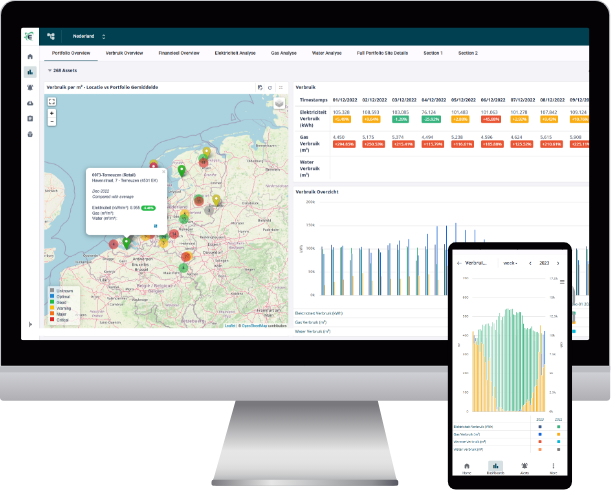
Technical solutions often fail because they are too complex for the people on the ground. The Energy Engagement Portal solves this via a simplified, mobile-first UX.
- Simplified UX: A dedicated, mobile-responsive portal designed for site managers and occupants.
- Transparency: By making energy data visible and digestible, we foster a culture of accountability.
- Automated Periodical Reports: Tailored reports are automatically pushed to relevant stakeholders, ensuring the right information reaches the right person at the right frequency—no manual intervention required.
4. Anomaly Detection and Action Management
This is the engine of the “Action-Oriented Journey.” The application utilizes advanced algorithms to detect deviations from expected patterns.
- Intelligent Alarming: Move beyond simple thresholds. The system detects drifts in consumption that indicate equipment failure or human error.
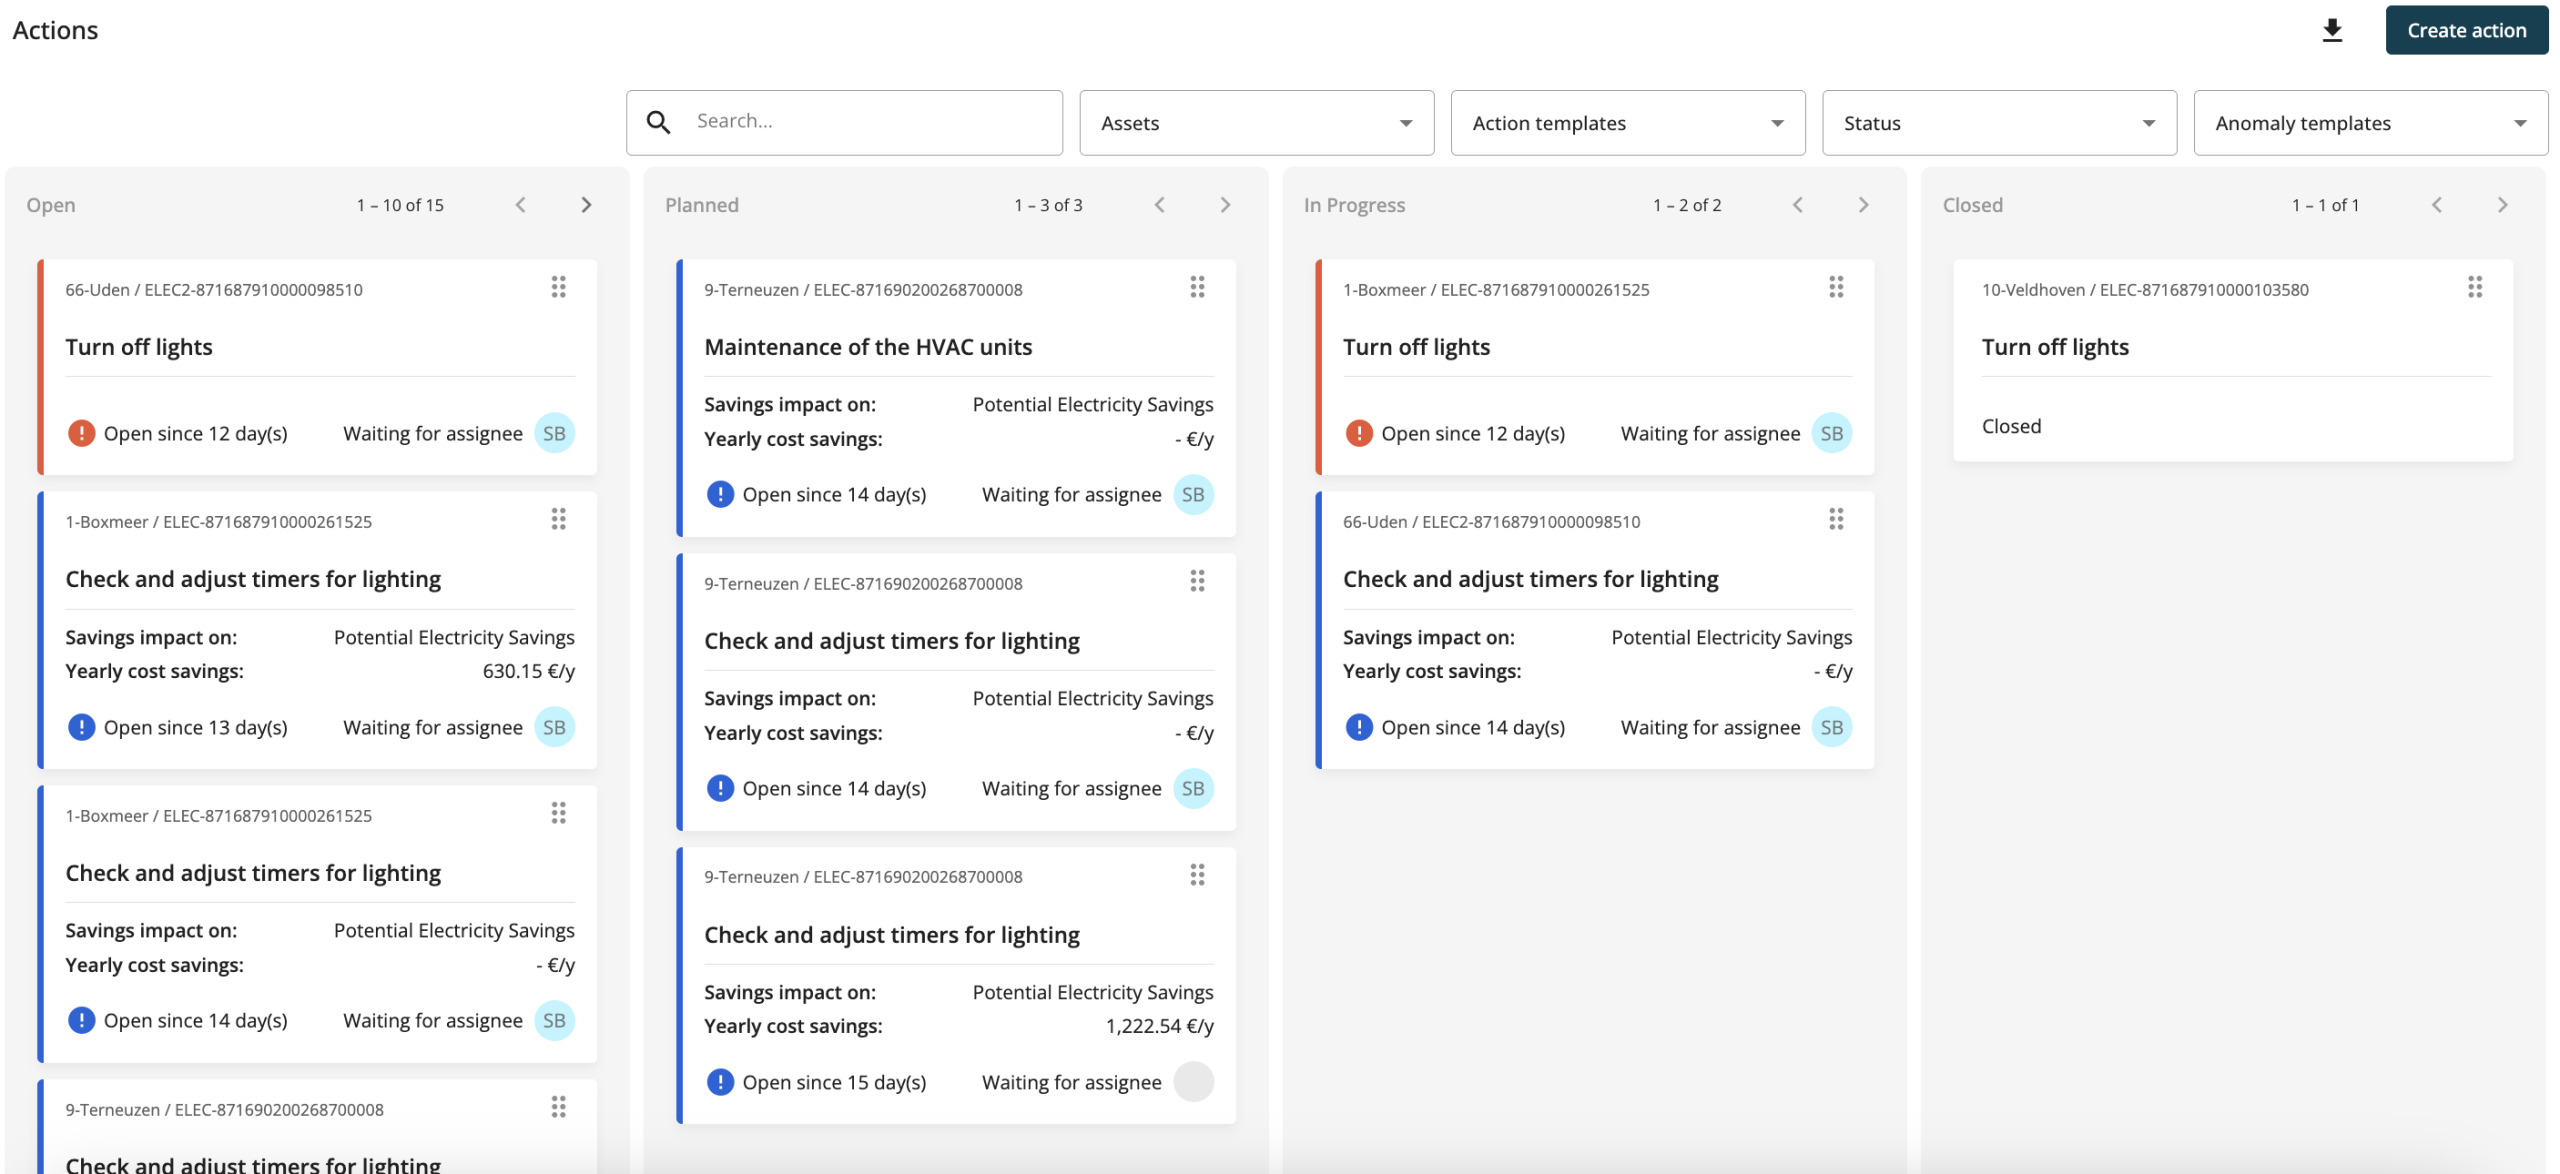
- Integrated Action Manager: Once an anomaly is detected, the workflow is contained entirely within the platform. No lost emails, no forgotten tasks.
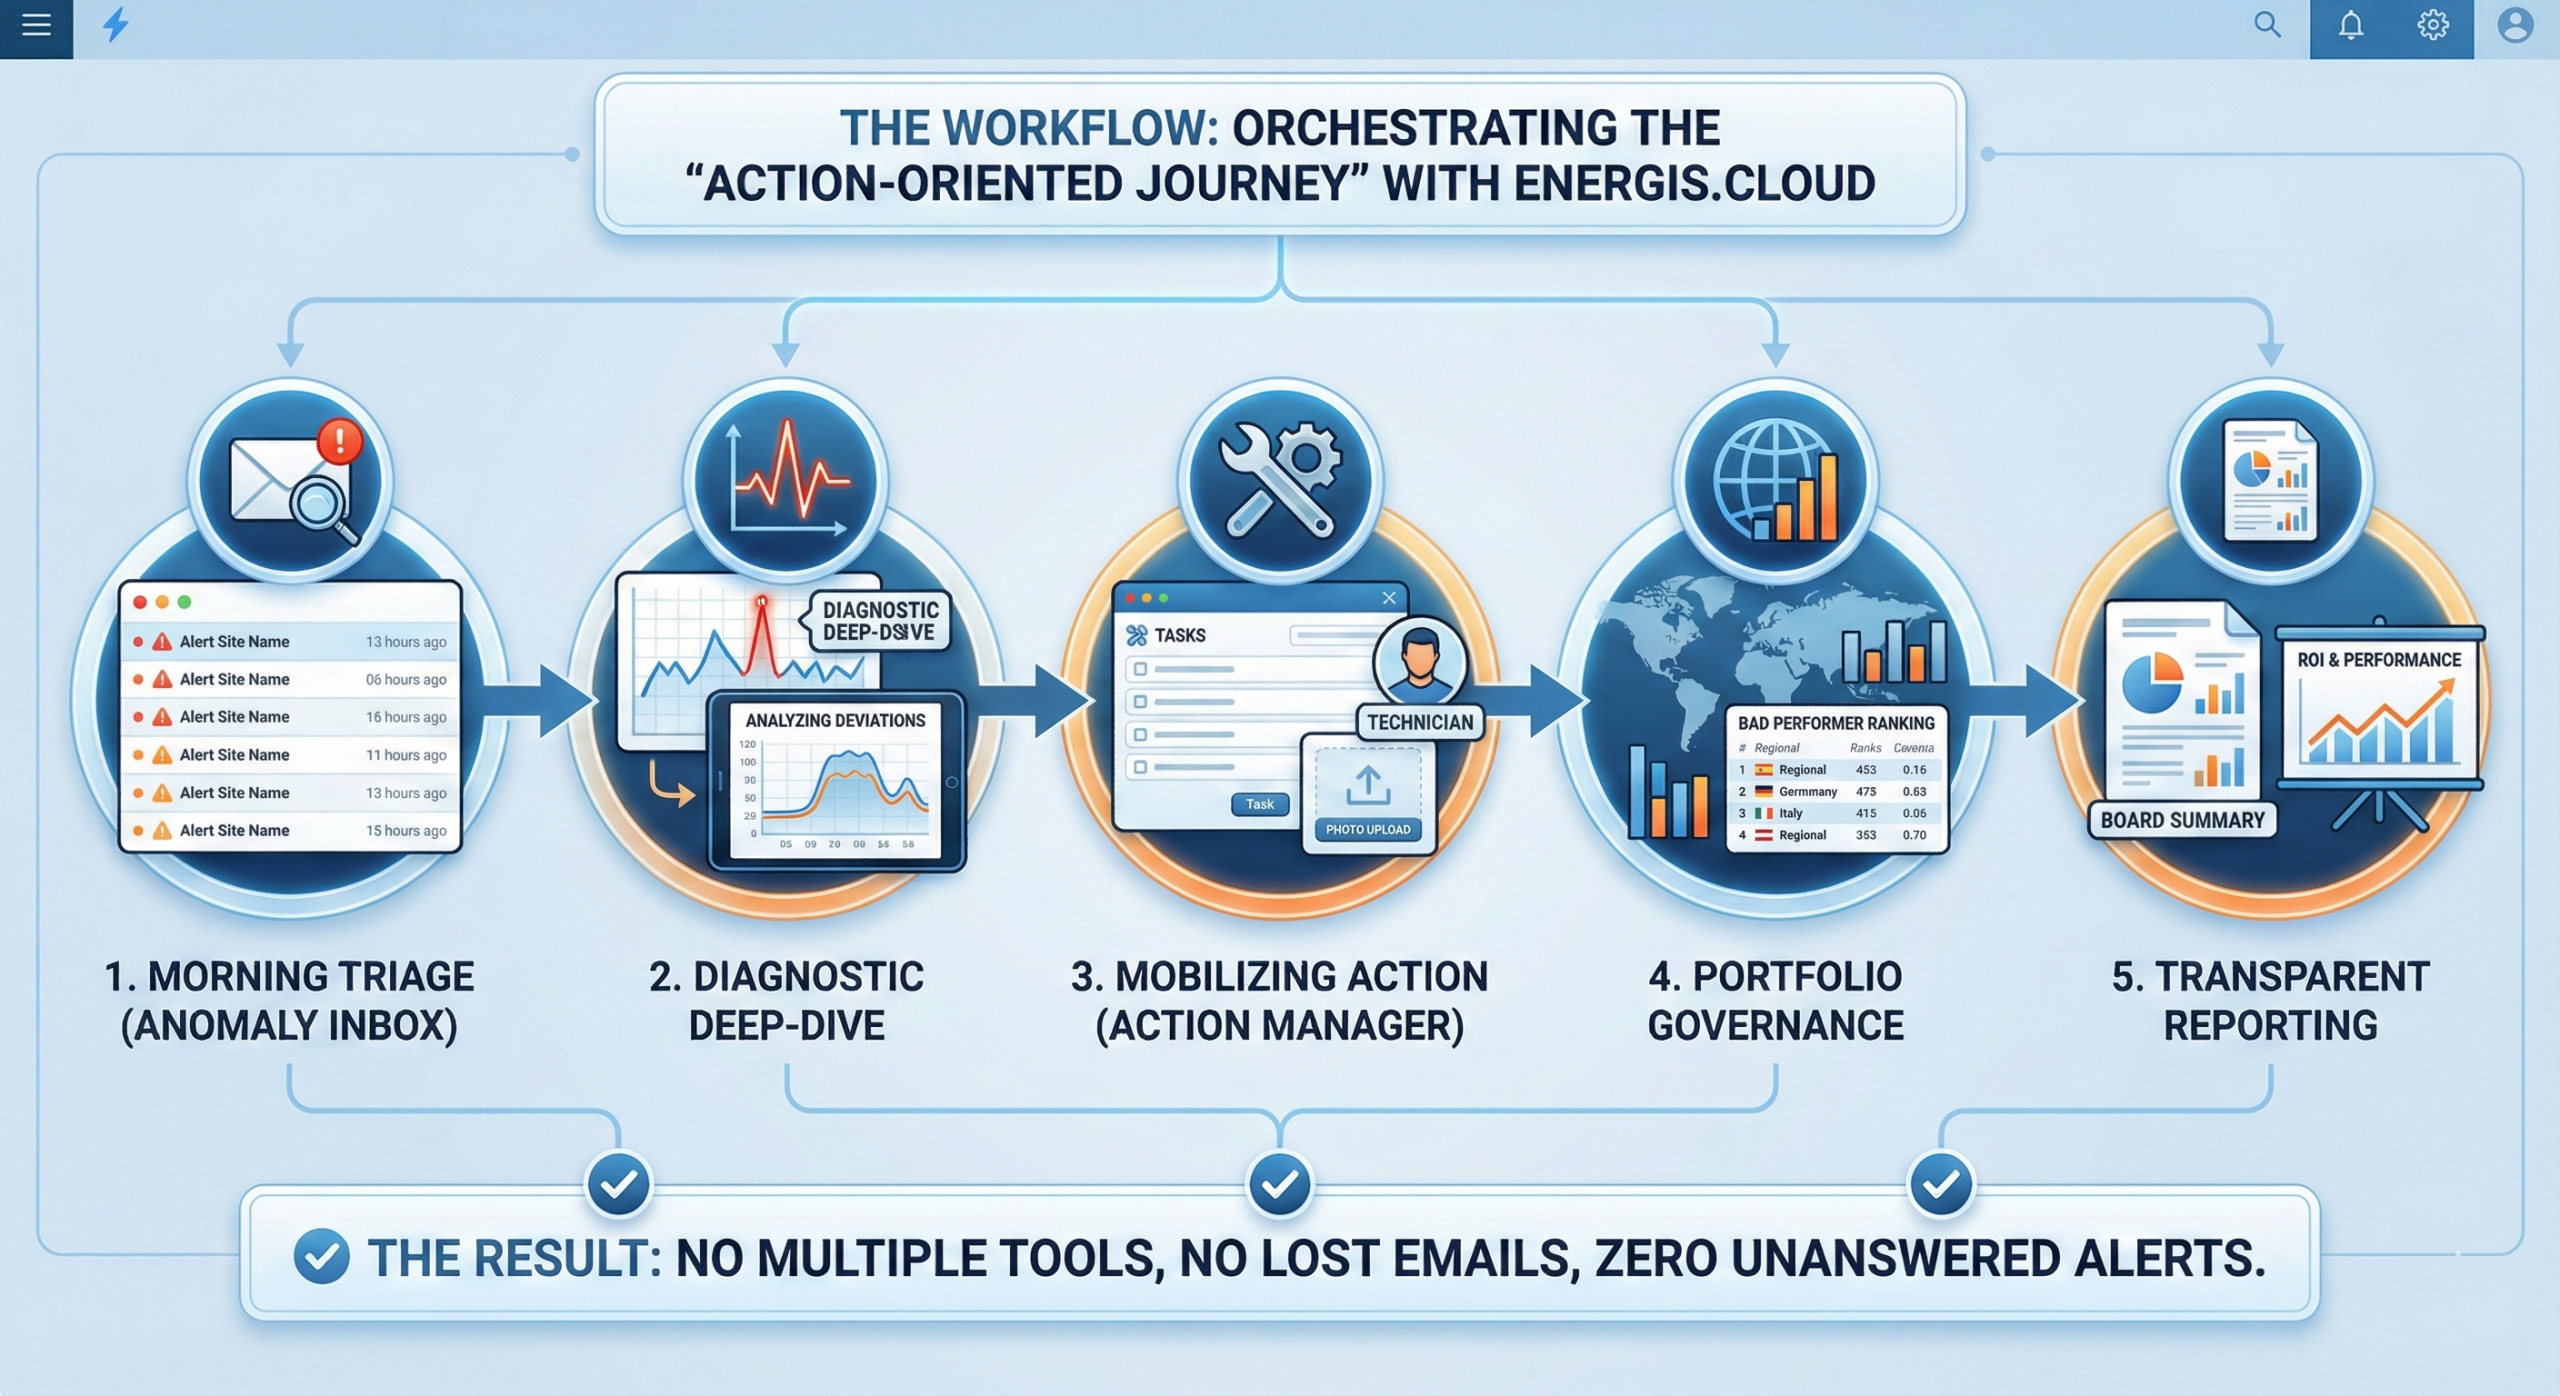
The Workflow: Orchestrating the “Action-Oriented Journey”
The value of the application is realized through a disciplined operational workflow. This is how high-performance energy departments operate within the Energis ecosystem:
- The Anomaly Inbox: The Energy Manager begins their day in the Anomaly Inbox. Instead of hunting for problems, the system presents the most significant deviations across the portfolio.
- Diagnostic Deep-Dive: Using integrated dashboards, the manager analyzes the load curve of the flagging site. They determine if the spike was a one-time event or a systemic failure.
- Mobilizing Action: Through the Action Manager, the energy manager assigns a task to the local facility team.
- Portfolio-Wide Follow-up: The manager then pivots to a portfolio-wide view to ensure that global performance is trending toward the quarterly objective. If one region is lagging, they reallocate resources based on the “bad performer” rankings.
- Transparent Reporting: With a single click, the manager generates a performance summary for the Board of Directors, proving the ROI of the energy department’s interventions.
The result: No multiple tools, no lost emails, and zero unanswered alerts.
Conclusion: The “CRM” for the Energy Department
In the same way that a Sales department cannot function without a CRM, or a Finance department without an ERP, a modern Energy Department cannot scale without a dedicated Consumption Monitoring Application.
Ambitious sustainability objectives require more than good intentions; they require a performant, scalable system that industrializes efficiency.
Key Functionalities at a Glance:
- Scalable Architecture: Built for portfolios exceeding 50, 500, or 5,000 sites.
- Universal Data Ingestion: API, IoT, and BMS compatibility.
- Advanced Analytics: Load curve, peak detection, and benchmarking.
- Closed-Loop Action Management: Integrated task tracking and resolution history.
- Engagement Portal: Mobile-optimized UX for non-technical stakeholders.
- Automated Governance: Periodical reporting and portfolio-wide KPI tracking.
Better Together: Boosting Detection with AI
The most effective way to use Energis.Cloud is by linking the Smart Electricity Waste Detection add-on directly to your Consumption Monitoring suite. While basic monitoring identifies energy waste based on fixed rules, the AI learns from your historical data to pinpoint the exact anomalies that matter most.
Maximize your results: Talk to an energy expert to see how combining these tools can uncover more savings with less manual effort.
Frequently Asked Questions
Yes. The Universal Metric Catalogue provides full tracking for all primary energy vectors, including Electricity, Natural Gas, Water, and Thermal energy.
No. The architecture is built to scale, supporting enterprise portfolios ranging from 50 to over 5,000 sites without performance degradation.
The platform is data-agnostic and eliminates data friction by ingesting information from any source, including IoT sensors, utility meters via API, BMS exports, or manual entries.
Yes. The Energy Engagement Portal provides a simplified, mobile-first UX specifically designed to make energy data digestible and foster accountability for site occupants and managers.
Implementation varies by portfolio size, but the universal data ingestion layer allows for a phased rollout, with initial dashboards typically live within 2 to 4 weeks of data access.


