

Product update
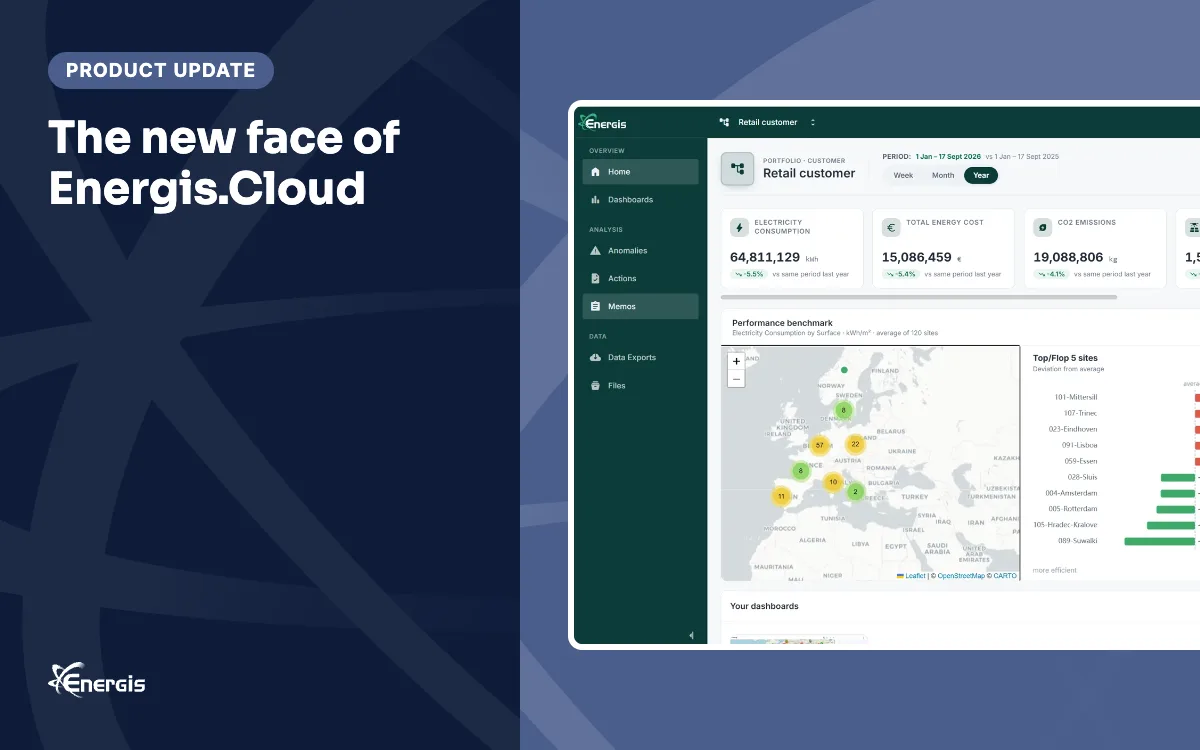
The new face of Energis.Cloud: a home page that answers

On this page
Executive summary
With release 26.2.2, Energis.Cloud opens on a new home page, and it changes what the platform is for the people who use it. Sign in, and everything that matters about your buildings is already in front of you: consumption and cost against last year, your savings target, how every site performs on a map, and exactly what needs attention today. From now on, when you think of Energis.Cloud, this is the screen you will think of.
Ten thousand buildings, ten minutes
Take a portfolio of ten thousand buildings on a Monday morning.
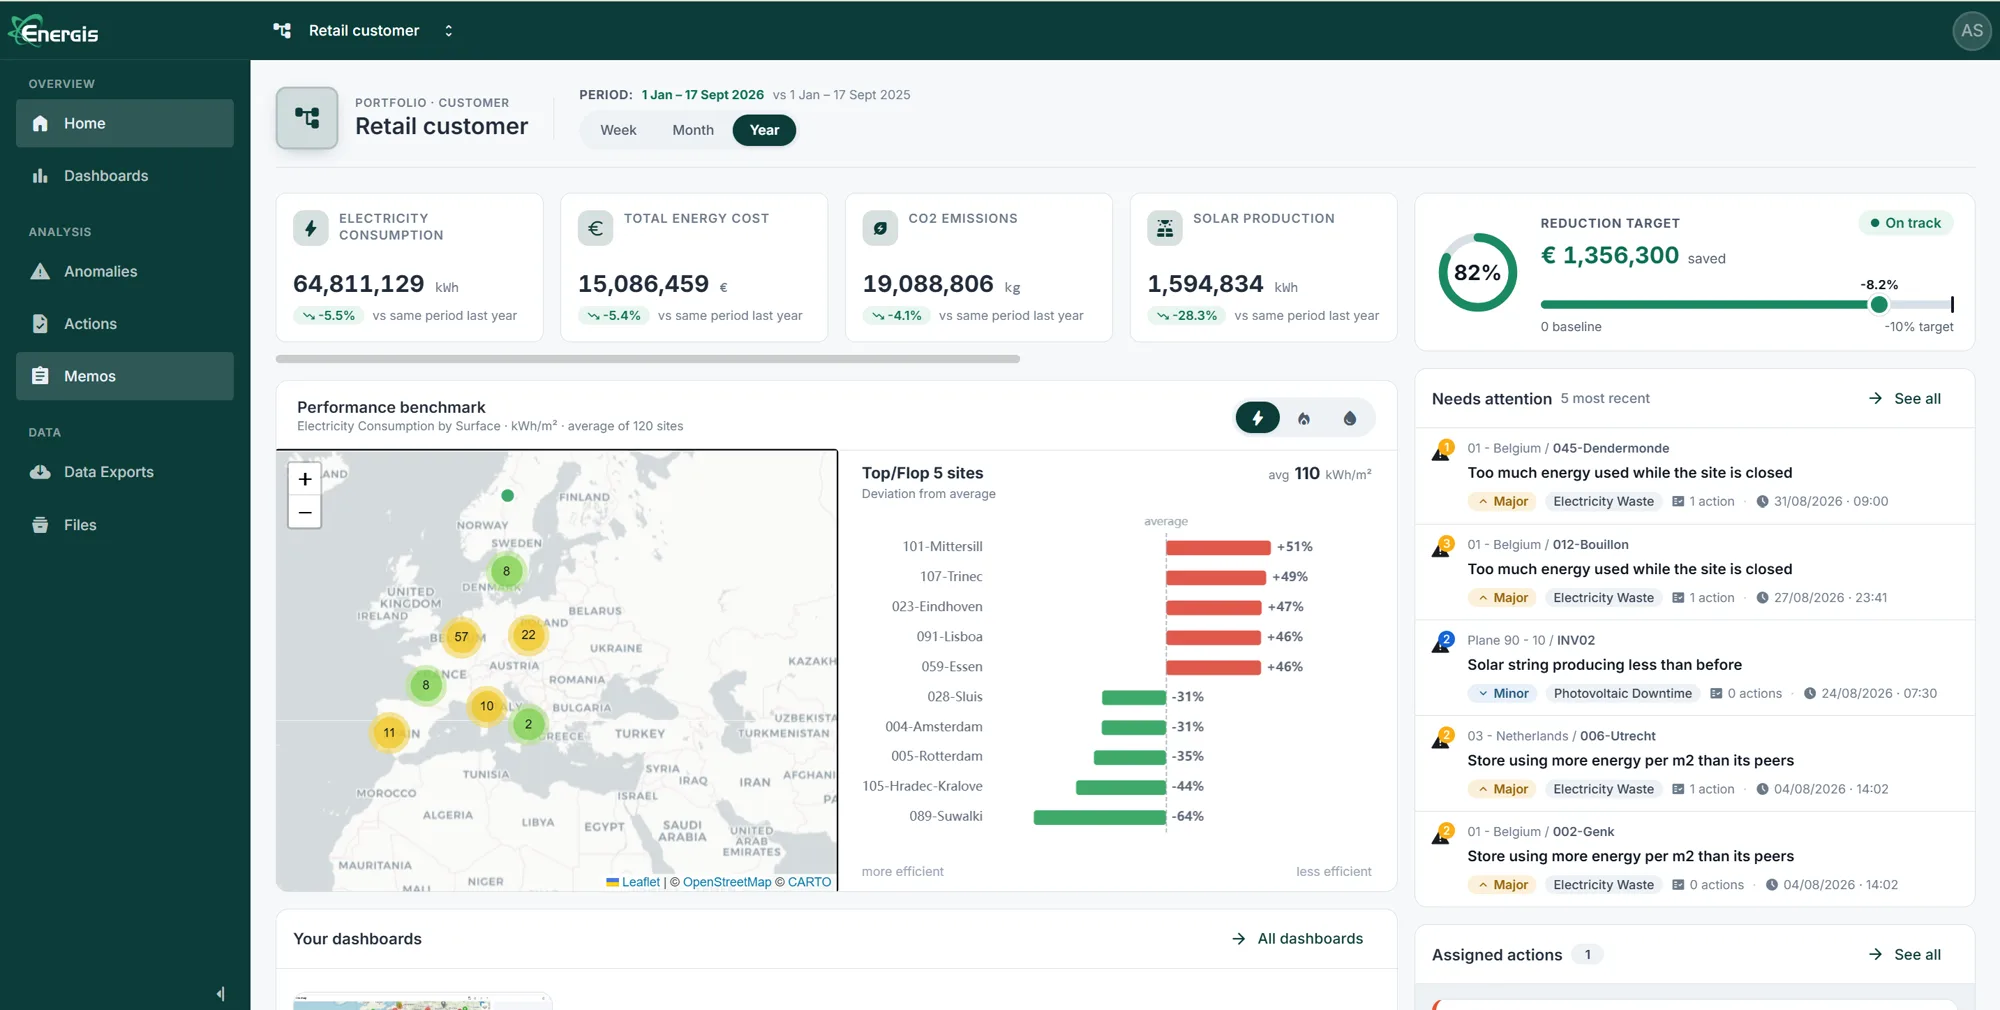
On the new home page, the answers come first. Your portfolio’s consumption and cost stand next to the same period last year. Your reduction target shows how much you have saved and whether you are on track. A map colours every site by performance, and your five best and five worst sites are ranked against your own average. The anomalies that appeared overnight are listed, newest first, with their severity. Within ten minutes, you understand everything that matters, across all ten thousand buildings.
Everything on one screen
The power of the page is not any single widget: it is that they sit together. The savings number next to the anomaly that threatens it. The map next to the ranking that names the outliers. Your dashboards, reports and data exports one click away. Energy management usually means assembling this picture yourself from five different modules; the new home page assembles it for you, live, every time you sign in.
It follows you down to every building and every meter
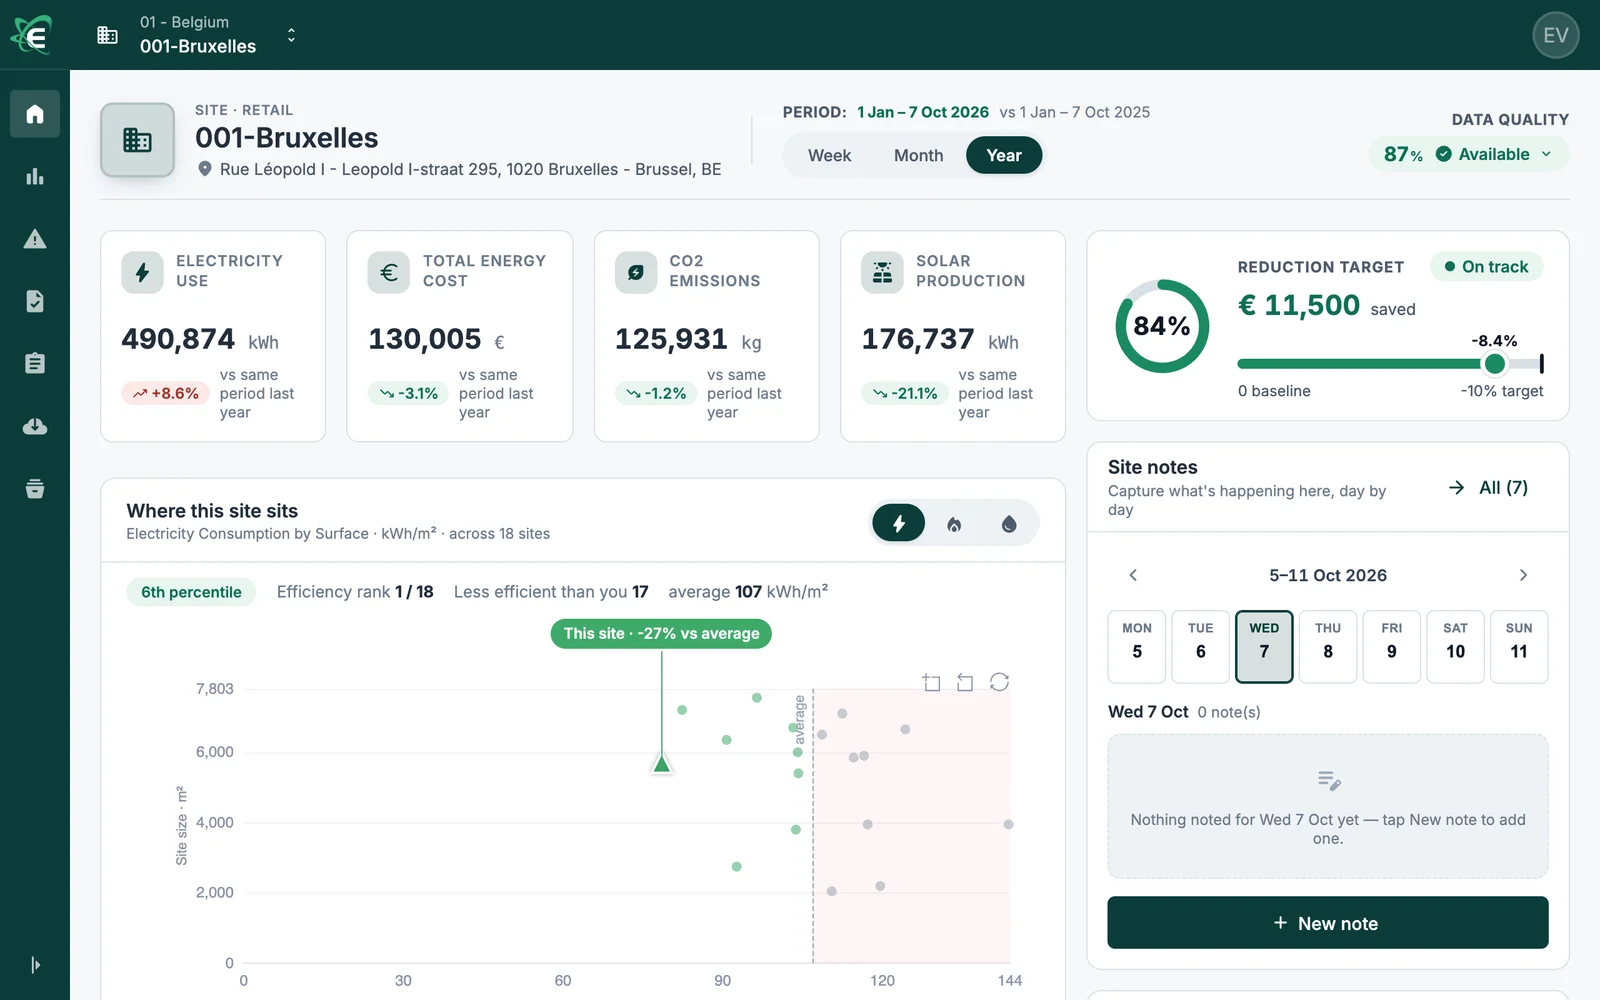
Select a site and the home page becomes that site’s answer: where it sits among its peers, its efficiency rank, its distance from your portfolio average, alongside its meters, its notes and its anomalies. A building manager sees in one glance whether their building is a leader or a laggard, and why.
Go one level deeper, to a single meter, and the page changes again: the consumption profile with its daily rhythm, every sub-circuit ranked by usage, and the meter’s full identity card (connection, supplier, contract) in one place.
One screen for the whole team
The Energy Engagement Portal exists because the people whose decisions actually move consumption, the CFO, the building owner, the maintenance lead, the occupants, are rarely energy specialists. The new home page is what makes engaging them easy: there is nothing to explain and nothing to configure, because the page reads the same way to everyone. The anomaly feed shows what is wrong, the actions show who is on it, and the numbers show whether it is working.
That changes how teams communicate. Instead of extracting figures into a slide deck before every meeting, you open the home page and talk about the same screen. More of your organisation uses the platform, because the platform finally speaks their language first.
In your pocket
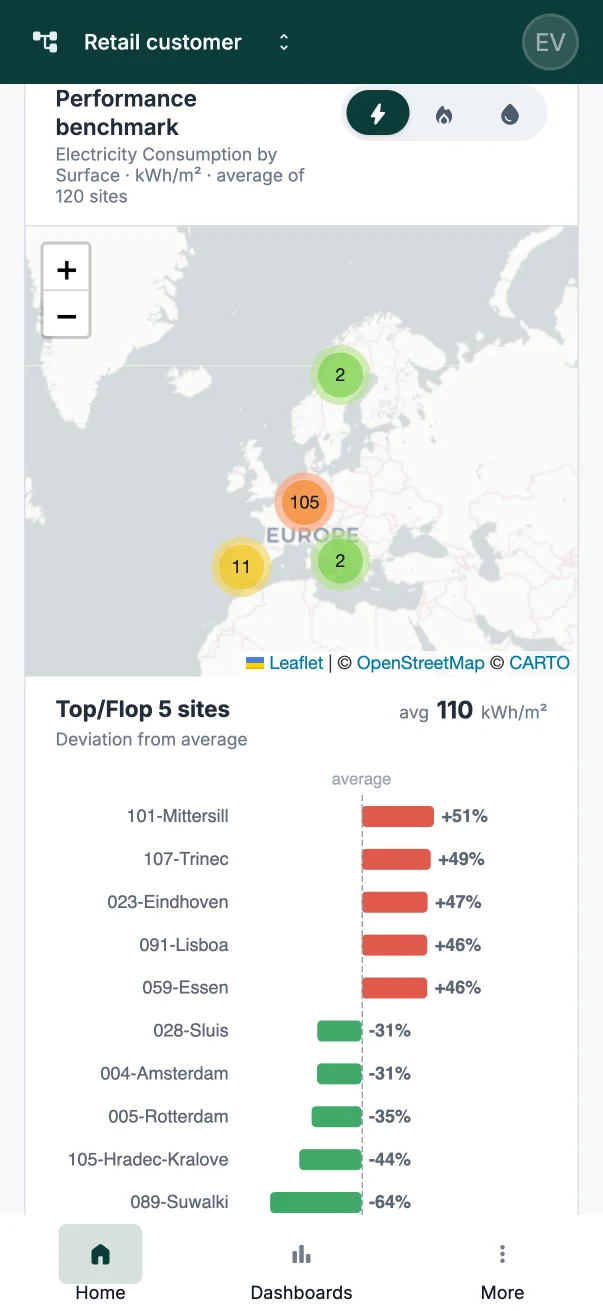
The portal is mobile-first, so the same answer travels. The performance map, the rankings and the anomalies render as an app on a phone, for the facility manager standing in the building rather than sitting behind a desk.
The front door of the Energy Engagement Portal
The home page is the new front door of the Energy Engagement Portal, the environment where dashboards, anomaly detection, action management, reports and data exports already work together for everyone around your buildings. What the portal always promised is now visible the moment you sign in: one place where energy performance is understood, discussed and improved by the whole team, not just the specialists.
Frequently asked questions
What does the Energis.Cloud home page show?
At portfolio level: consumption and cost against the same period last year, progress towards the reduction target, a map of every site coloured by performance, the best and worst five sites against your own average, and the latest anomalies. A site and a meter each get their own version of the page.
Do I need to configure the home page?
No. It reads the same way to everyone and needs nothing set up: it uses the portfolio, sites and meters already in the platform.
Does it work on a phone?
Yes. The Energy Engagement Portal is mobile-first, so the map, the rankings and the anomalies show as an app on a phone.
Which release brought it?
Release 26.2.2, in August 2026. See the release page.
New articles and product updates by email
Guides, customer stories and what is new in Energis.Cloud. You can unsubscribe at any time.
We use your email address only to send these updates. See our privacy policy.