
Release
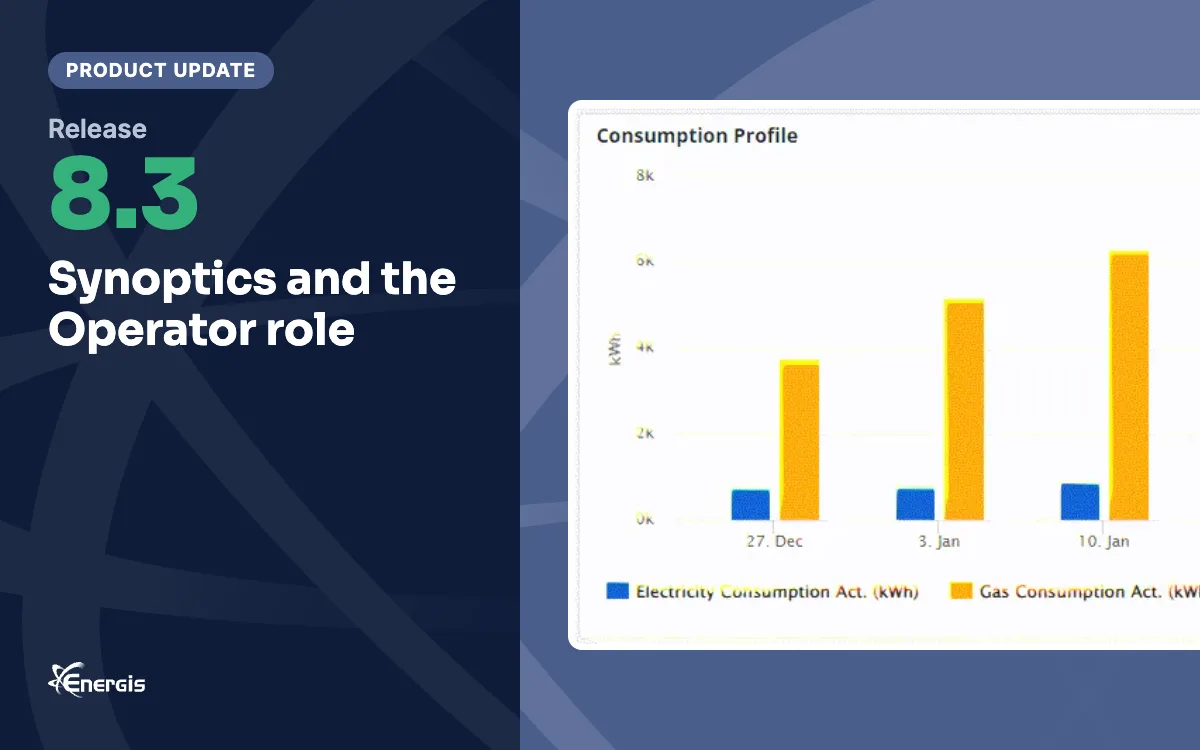
Energis.Cloud Release 8.3: Synoptics and the Operator role

- Change periods without entering widget configuration, synchronised per section
- New period selector and granularity selection on widgets
- Multi-metric table and profile chart widgets
- Synoptics: real-time data positioned on uploaded background images
- Operator user role for daily analysis without changing the global setup
In release 8.3, our focus is on better interaction with data in dashboards, so you can perform your analysis faster, more easily and with more options. We also offer a new analysis tool, Synoptics, designed specifically for real-time data streams.
Next, we introduce a new user role, Operator, with permissions tailored to work in the platform without affecting the global setup of assets, metrics and alert configurations. Finally, we are improving the user experience in several areas.
What’s new
Simpler and more powerful period interaction
You can change periods without going into the configuration mode of widgets. Widgets of a dashboard section or a report template can be synchronised with a single global period or remain independent of each other.
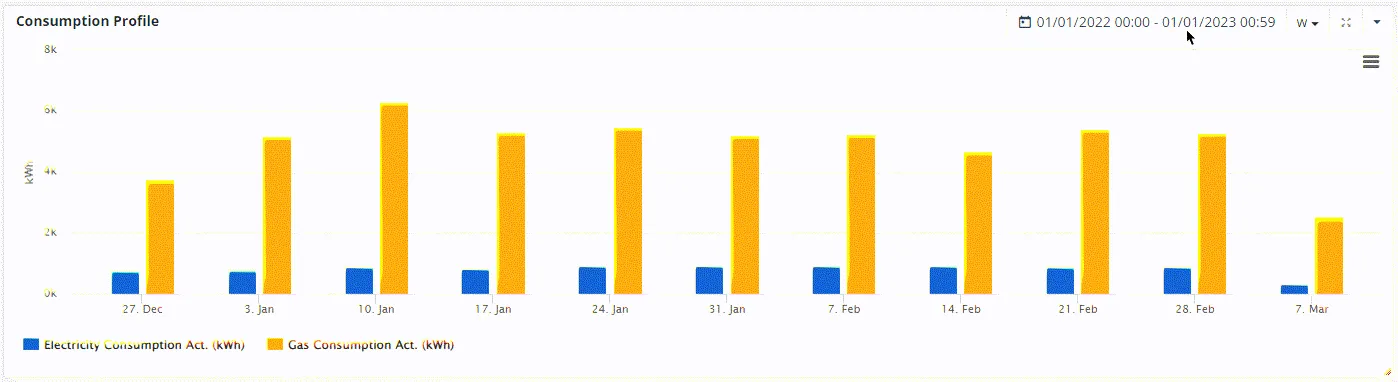 A consumption profile widget with its period (01/01/2022 to 01/01/2023) in the header, where it can be changed without opening the widget configuration.
New period selector
An intuitive period selector, available in the sections or in the widgets.
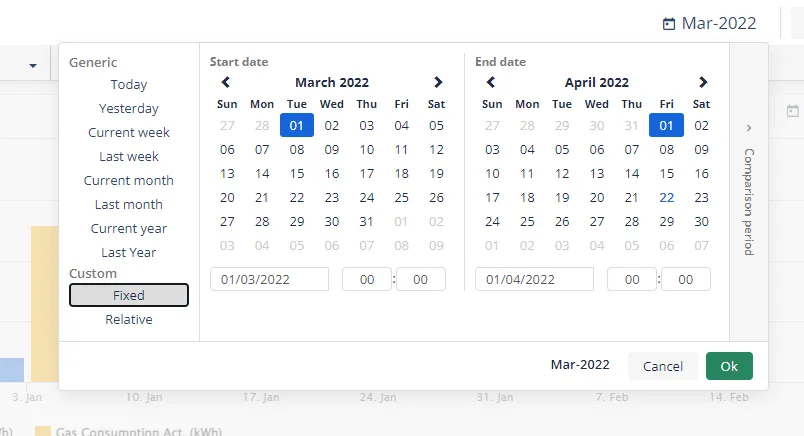 The period selector: generic periods on the left, custom fixed or relative periods, and a start and end calendar.
Granularity selection on widgets
You can select the display granularity from a dropdown list positioned on the widget.
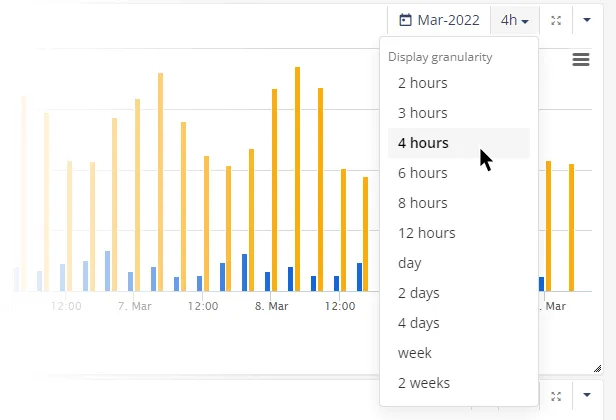 The display granularity dropdown on a chart widget, with steps from 2 hours to 2 weeks.
New widgets
Two new single-asset widgets are available for both dashboards and reports: multi-metric table and profile chart. Both are quick to set up and their period can be synchronised.
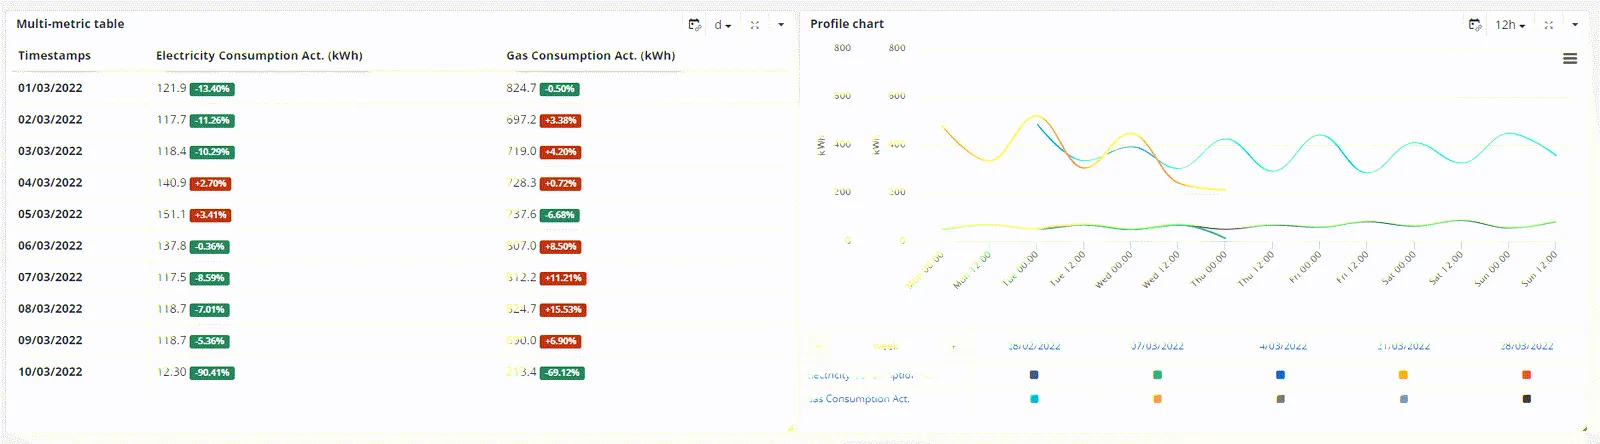 The two new widgets: a multi-metric table of daily electricity and gas consumption with the change per day, and a profile chart that lays several weeks over each other.
Synoptics
A real-time data monitoring tool that allows you to position and view data on uploaded images used as backgrounds.
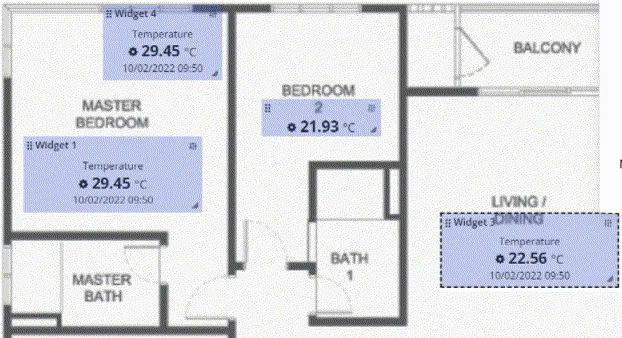 A synoptic: temperature readings placed on the rooms of an uploaded floor plan, each with the time of its last value.
New Operator user role
A user role with permissions tailored to daily analysis in Energis.Cloud, including dashboards, reports and alert management, without the possibility to change any global setup of assets, metrics and alert configurations.
UX improvements
A new widget selector that guides you in dashboard and report setup, the possibility to add widgets without a title, and a confirmation pop-up if you leave a page without saving your changes.
New articles and product updates by email
Guides, customer stories and what is new in Energis.Cloud. You can unsubscribe at any time.
We use your email address only to send these updates. See our privacy policy.