

Blog
Finding electricity waste on every site

On this page
Introduction
With volatile energy prices and stricter ESG reporting, multi-site organisations face a specific liability: “dark data”, large volumes of energy readings that are collected but never analysed. Electricity waste hides in that data: equipment left on at night, HVAC running in an empty building, a site that slowly drifts away from its peers. Waste Finder (formerly Smart Electricity Waste Detection) is the Energis.Cloud app that checks every site for this kind of waste and turns each finding into work with an owner.
Why multi-site portfolios need systematic detection
As portfolios grow, the real obstacle is the fragmentation of information, as described in our article on scaling multi-site energy management.
- The data overload: organisations hold thousands of CSV files and sensor logs. When data is checked by hand, waste stays hidden in plain sight.
- The “apples to oranges” problem: building age, technical installations and local climate differ from site to site, so performance can only be compared with a common yardstick, such as consumption per m² or the share consumed outside opening hours.
- The invisible drain: without a rule that checks every site, silent waste becomes the new normal.
Watch: an expert session
In this three-minute expert session, recorded when the app was still called eGuardian, we show how it found more than €250,000 of wasted energy for a French fashion retailer with about 200 stores: 9% of their total consumption.

How Energis.Cloud finds the waste
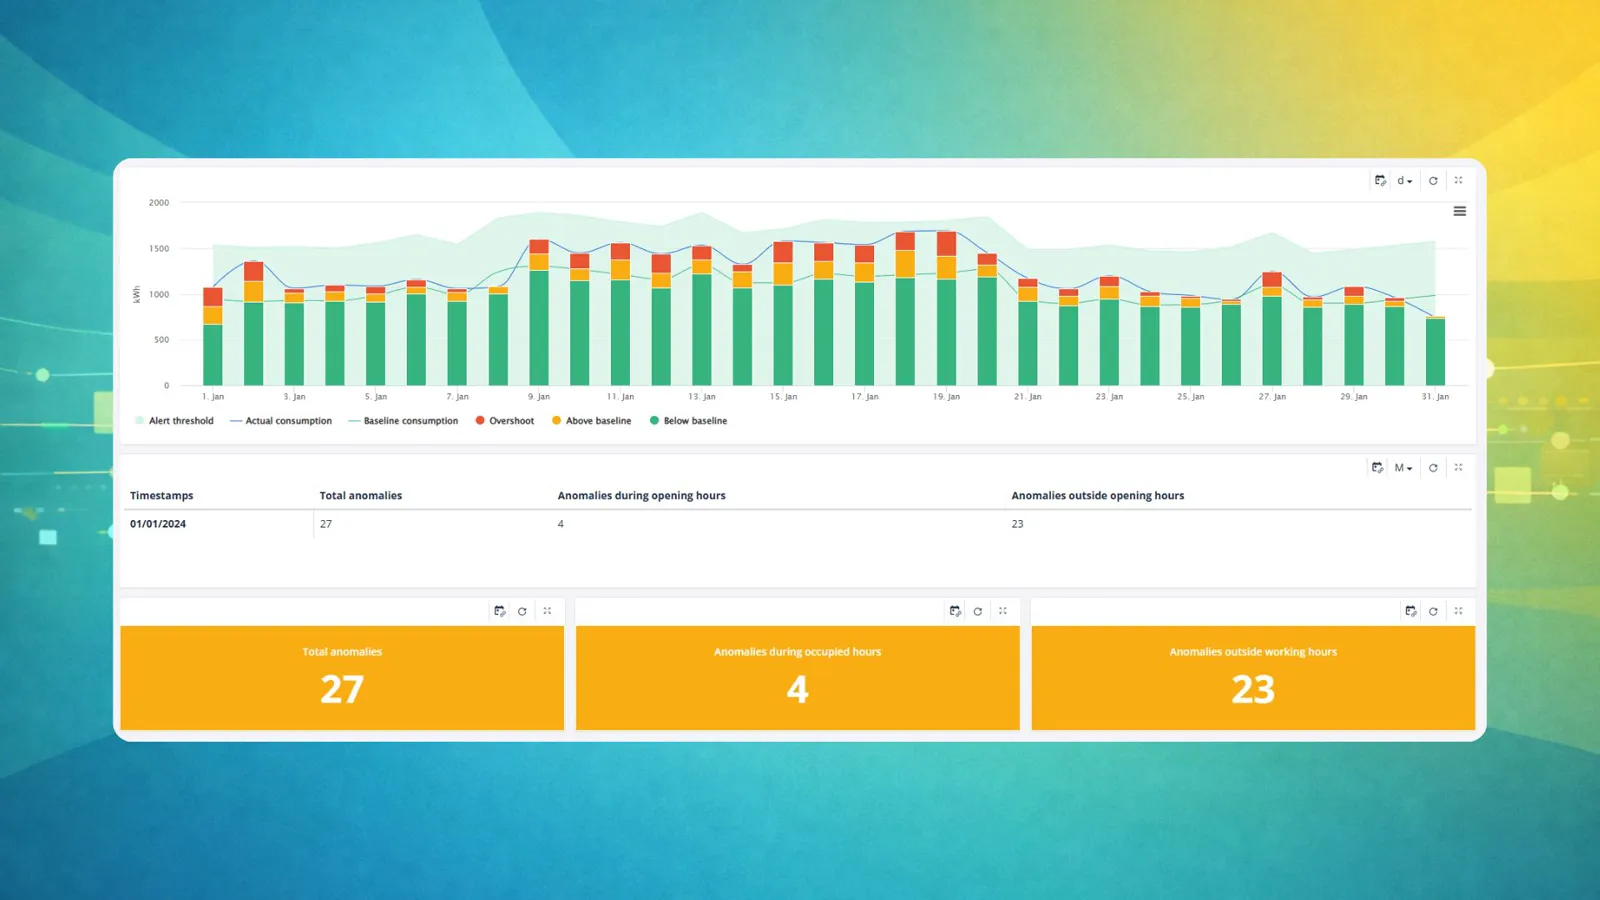 The Waste Finder app: daily electricity consumption against the normal consumption learned for the site and an anomaly threshold: bars turn orange above the baseline and red where they overshoot, and the counters split the month’s anomalies between opening hours and outside them.
- Waste Finder learns each site’s normal use: the Waste Finder app compares each day’s consumption with the normal consumption it learns from the site’s own history, and counts what goes beyond it during and outside opening hours. Nobody has to set a threshold per site.
- Rules you write, on top: an anomaly rule is a condition in plain arithmetic on any metric, including a formula. For example: electricity consumed outside opening hours above 30% of the week’s total.
- One template for the whole group: the rule belongs to a group and runs on every site in it, with a per-site threshold from a lookup where one is set. A site added to the group later is covered too.
- Escalation in the order you choose: the first occurrence stays quiet, the second mails the person responsible for the site, the third goes to a named manager, each time with your own email template.
- From finding to action: the anomaly becomes an action on the board, with an owner, a date and an estimated saving, then the saving you measured once the fix is done. See anomalies and actions.
- Notes on the data: memos sit on the chart timeline, so the reason behind a change stays next to the numbers.
The dashboards
- Portfolio dashboard: ranks the sites on the metrics you choose, so the worst performers are at the top of the list.
- Site dashboard: a simple drill-down that gives local managers the data they need to act.
Orbit can then read the data, the memos and the actions together, list the most likely causes and recommend the next step. See Orbit.
Conclusion
Multi-site energy management does not need to be a manual search. With rules that run on every site, escalation to the right people and an action board that records the saving, waste is found, assigned and followed until it is fixed.
Frequently asked questions
What is anomaly detection in energy management?
Anomaly detection checks energy data against what is normal for it, and raises an anomaly when it goes beyond. In Energis.Cloud, the Waste Finder app learns the normal electricity use of each site from its own history, and anomaly rules let your team add its own conditions, on any metric, and it runs on every site in the group, so an HVAC system running on an empty site is flagged without anyone looking at the chart.
How is electricity waste detected on a site?
With rules that compare what a site consumes with what it should consume: the share consumed outside opening hours, the consumption per m² against the other sites, the peak power against the contracted power. Each rule can carry a per-site threshold, so a small site and a large one are judged by their own standard.
What exactly is “dark data” and why is it a problem?
“Dark data” refers to the large volumes of energy information collected by meters and sensors that are never analysed or used to make decisions. For multi-site organisations, this often results in a complexity trap: plenty of data, few decisions. Rules that run on every site bring this data back into use.
Do I need to install new hardware?
Usually not. Energis.Cloud has 121 data-source connectors, among them grid operators, metering companies, inverters, measurement devices, gateways, building systems and weather. Data can also arrive through HTTP, MQTT, SFTP, email or a file uploaded through the portal. See data collection.
How is the saving of a fix recorded?
On the action itself. An action raised from an anomaly carries an estimated saving in energy, money and CO₂, and the saving you measured once the work is done. The figures add up across the portfolio.
New articles and product updates by email
Guides, customer stories and what is new in Energis.Cloud. You can unsubscribe at any time.
We use your email address only to send these updates. See our privacy policy.