

Release
Energis.Cloud Release 9.3: precomputed dashboards

- Precomputation of slow dashboards and report templates
- Data freshness indicator, with a forced refresh per widget or per section
- Filter pop-ups: type right away and validate with the Enter key
- ${asset.id} keyword for asset-aware dashboard links in email templates
In release 9.3, we focused on improving the performance of the system for dashboards that process large amounts of data.
Precomputation of dashboard content
You can now reduce the loading times of complex dashboards by precomputing their values. Once precomputed, the values load much more quickly. The system also tells you how long ago the precomputation happened. If it is too old, you can always force a data refresh, per widget or for the whole section. In this case, the usual loading time applies and the resulting values become the new precomputed values for you and your colleagues, today and later.
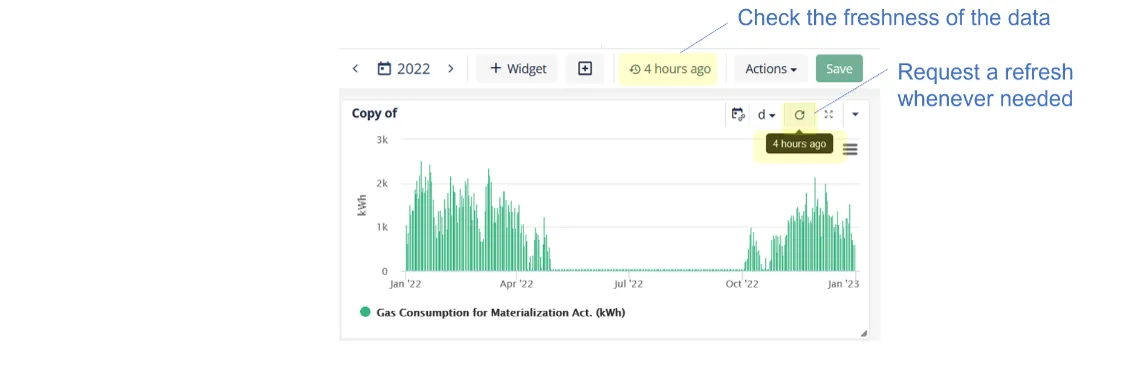 The freshness indication in the dashboard header (4 hours ago) and the refresh button on a widget, which recomputes its values on request.
To force a refresh of the whole section, press the freshness indication. In the pop-up window that appears, you can also view the data freshness per widget by clicking “More information”.
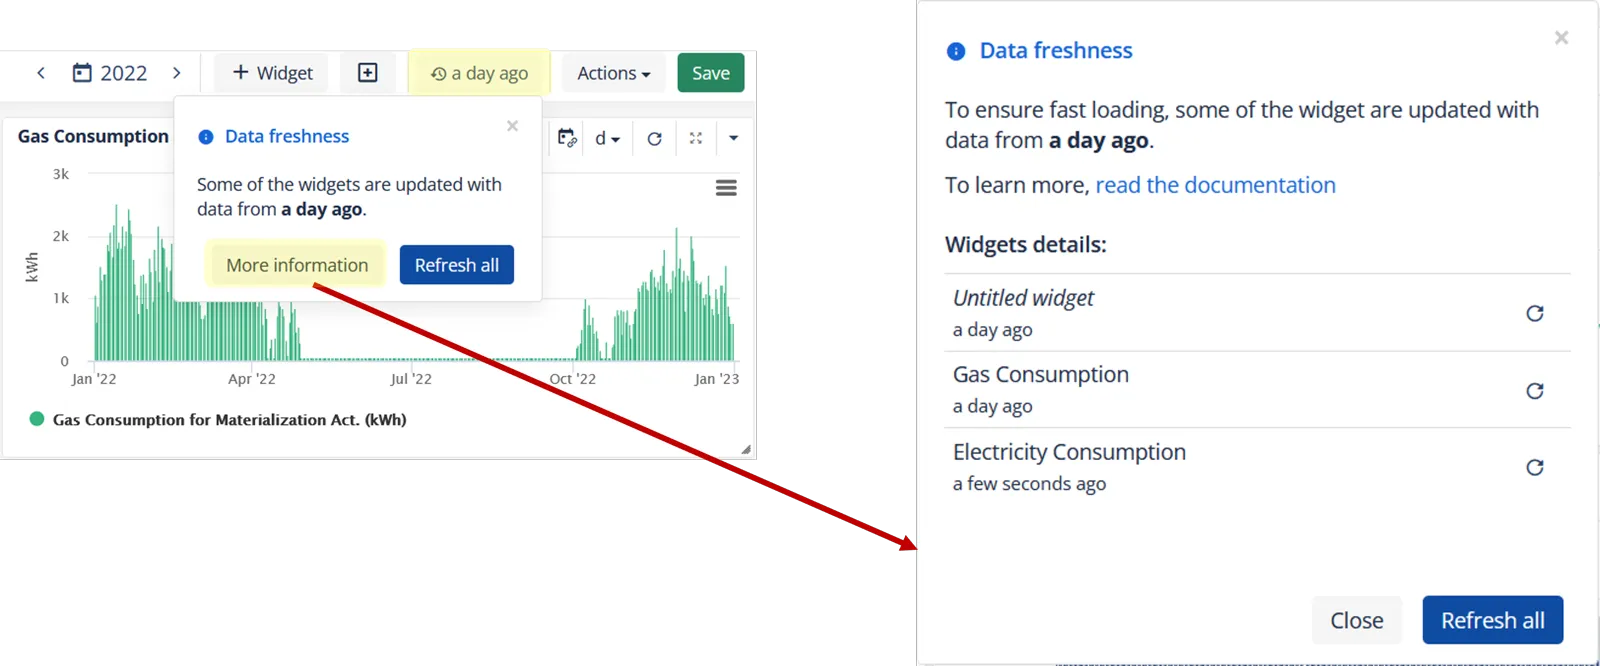 The Data freshness pop-up with its Refresh all button, and the detail panel opened from More information, which lists each widget with the age of its data.
Activating precomputation for slow dashboards
When a dashboard is slow, contact Energis Support and we will optimise it.
The same optimisation mechanism can also be applied to report templates. Note, however, that the generated PDF always uses fresh data (updating the precomputed values in the process).
How it works behind the scenes
To optimise a dashboard or a report template, Energis.Cloud “materialises” the slow metrics it contains. For the period(s), granularity(ies) and asset(s) shown in the dashboard or report template, Energis.Cloud checks whether the corresponding values were already computed by any user in the past 7 days and shows these values if available. If not, it computes the values normally, without precomputation, and stores the result for the next time the same query is made.
Energis.Cloud can only precompute metric values that match one of these granularities: 1 hour, 2 hours, 3 hours, 4 hours, 6 hours, 8 hours, 12 hours, 1 day, 2 days, 4 days, 1 week, 1 month, 1 year. This means, for instance, that the value of a Single value widget with the period Last 7 days cannot be precomputed (unless it happens to match a full week).
Miscellaneous
-
Improved filter pop-up windows: when opening a filter menu to filter a list, you can now type the filter text right away (without first clicking on the text search field) and use the “Enter” key to validate the selection. Pop-up windows are also more stable and no longer close abruptly when you click outside the box.
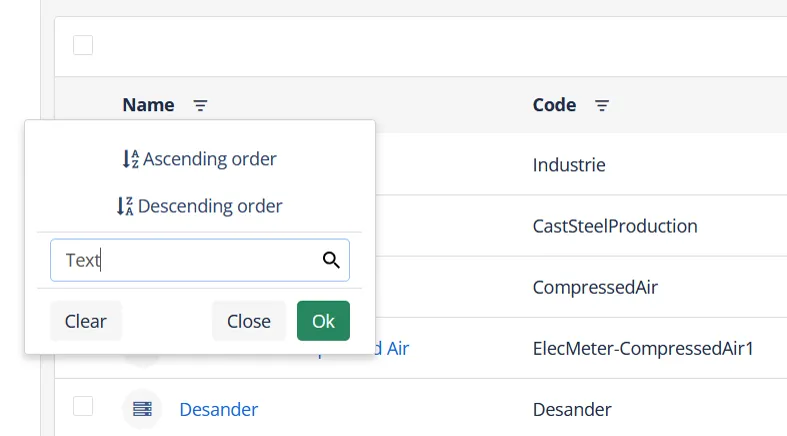 The filter pop-up of a list column: sort ascending or descending, or type the text to filter on and press Enter.
-
Include an “asset-aware” dashboard link in automatic emails (admin only): a new “${asset.id}” keyword can be used in email templates which, combined with a dashboard URL, creates an asset-dependent URL.
If you have any questions or comments about this release, contact Energis Support.
New articles and product updates by email
Guides, customer stories and what is new in Energis.Cloud. You can unsubscribe at any time.
We use your email address only to send these updates. See our privacy policy.