

Release
Energis.Cloud Release 9.1: performance and data analysis tools

- Shorter loading times for dashboards and reports
- Zooming and panning in charts
- Show dots for data points and Cut line when no data options
- Peak removal for meter data with missing index values
- Memos from child assets and a memo Status column
With release 9.1, we continue to develop Energis.Cloud as an evolving, high-performance platform that responds to changing needs. This release answers requests we received from you.
With this new release, we focused on two aspects: improving system performance and extending the existing data analysis tools.
All the updates are listed below.
Improvements
Performance improvements
We introduced new mechanisms to reduce the perceived loading times of dashboards and reports.
- Increased front-end cache to improve the fluidity and responsiveness of the system when configuring widgets or multi-widget sections, or when visiting the same page multiple times.
- Computation tasks folding improves the responsiveness of light widgets when heavy widgets are processed in the same section.
Zooming and panning in charts
With release 9.1, we introduce a new way of zooming on data, and an easy way to move to nearby periods (pan to the period on the left or right of the currently displayed period).
Zooming can be done either by creating a sliding window on a chart (click, hold, drag, release) or by clicking on a bar or a point of the chart.
New widget options
You can now display the dots corresponding to data points on the chart lines. This way, it is immediately visible whether data is present or not.
To enable this option, select the “Show dots for data points” option in the Display configuration menu of metrics in Multi-metrics charts, Multi-assets charts, Profile charts and Multi-periods profile charts. The dots are visible with both the Line and Area plot types.
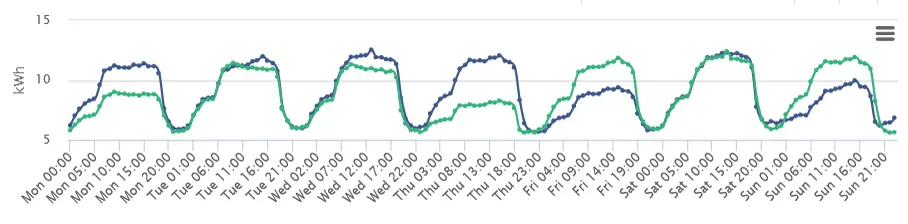 Two weekly load curves with Show dots for data points enabled: every reading appears as a dot on the line.
For more flexibility, we introduced an option called “Cut line when no data”. It can be selected independently for every metric from the widget configuration panel. When disabled, the line interpolates the missing data. When enabled, the curve leaves the missing data apparent.
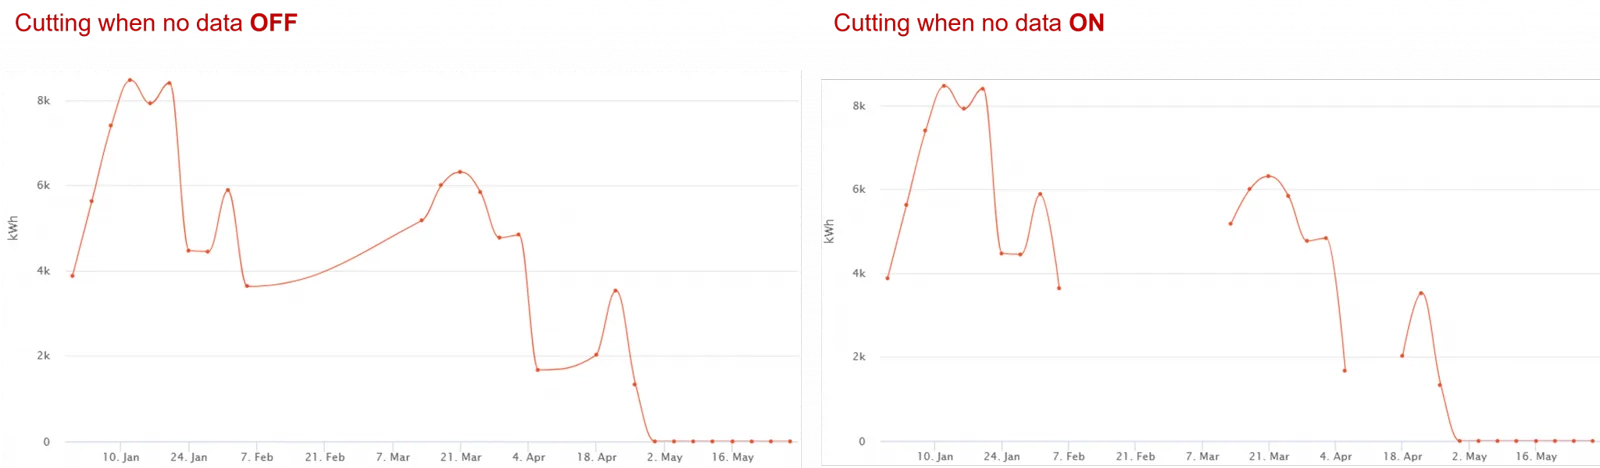 The same series with Cut line when no data off (left), where the line bridges the missing weeks, and on (right), where the gaps stay visible.
Peak removal
Peak removal flattens high peaks which may occur when visualising meter data with missing index values (i.e. coming from data metrics with the Counter option ON). Such peaks happen because the difference between the index readings after and before the data loss is stored on a single timestamp.
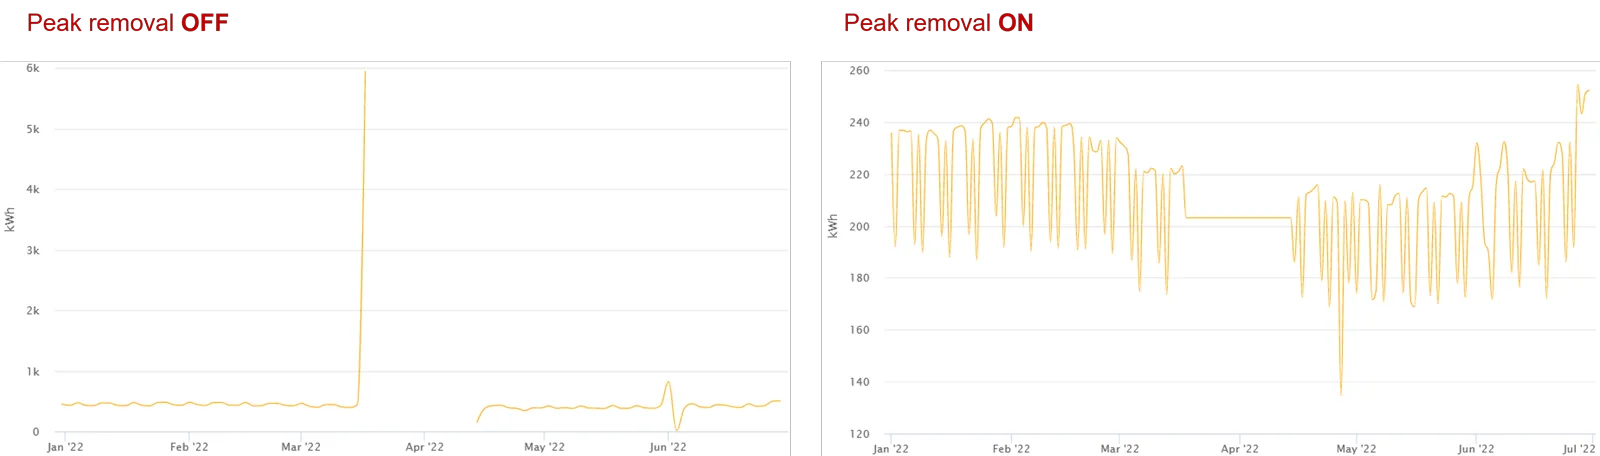 Peak removal off (left): the index jump after a data gap shows as a single spike of almost 6,000 kWh. Peak removal on (right): the same energy is spread evenly over the missing period.
Memos improvements
Memos are a useful tool to record any event related to an asset. In the 9.1 release, the memo page shows both the memos of the selected asset and those of its children. For example, by selecting a group, you see the memos of the group and of all the sites, meters, etc. in this group. Finding a given memo therefore no longer requires finding the related asset first: it is enough to select one of its parents.
Moreover, we introduced a Status column which allows using memos as a light task manager, on top of an event database.
Invoice digitisation improvements
We enhanced the invoice digitisation module with the following features.
- A new logs page is available to authorised users in the Setup > Invoice activation status menu. This page provides information about the sync events that are required to link invoices with meters, sites and users, e.g. when creating new meters, to help verify the process and troubleshoot when needed.
- The asset tags are now carried over to the invoice analysis module. Add a tag from the asset edition page or from the Asset tags page to force syncing and pushing the tags to the invoice analysis module.
This module has since been retired.
Miscellaneous
- Report templates: we improved the PDF rendering by revising the scaling mechanism of the report’s content.
- We added a new “Notes” field in the user details page to keep track of additional data related to the user.
- When creating new users, the asset domain is initialised to an empty domain (instead of a full domain) to prevent mistakes and oversights while selecting the domain.
- We improved the email that new users receive, with better guidance to request a new password.
- In the Asset tags page, we added new Code and Parent site columns, to extend the filtering possibilities.
Bug fixes
- CSV export of Multi-asset table not working.
New articles and product updates by email
Guides, customer stories and what is new in Energis.Cloud. You can unsubscribe at any time.
We use your email address only to send these updates. See our privacy policy.