


Executive Summary
The Dashboard Myth: Why More Data Has Led to Less Clarity
The modern enterprise is awash in data, but when it comes to scaling multi-site energy management across dozens or hundreds of locations, more data often means less clarity. There is a common assumption that having access to various building dashboards equates to having control over portfolio performance. In reality, this often masks a critical operational bottleneck: data without intelligence.
Simply funneling raw information from hundreds of meters into disconnected systems doesn’t yield insight; it creates noise. For the Energy Manager, the challenge is no longer obtaining data, but standardizing it. Distinguishing between raw data points and actionable intelligence is the first strategic step toward transforming energy from a chaotic overhead into a streamlined, proactively managed asset.
- 1.1. The Illusion of Control in a Volatile Market The European energy landscape is shifting toward unprecedented volatility and this makes scaling multi-site energy management more difficult. McKinsey analysis suggests the annual price deviation for electricity could surge by 60% to 170% by 2050 as renewable integration accelerates. This reality renders traditional energy procurement strategies obsolete. Energy is no longer a fixed overhead; it is a dynamic, unpredictable input that directly dictates the success of financial planning. In this landscape, fragmented data ceases to be an administrative issue and becomes a critical failure in financial risk management.
- 1.2. The Reality of Data Fragmentation: Most multi-site organizations operate with a fractured technical stack. Data remains siloed across utility portals, specialized monitoring for renewables (PV) and battery storage (BESS), EV charging platforms, and traditional Building Management Systems (BMS). This creates a fractured view of performance, making it nearly impossible to gain a global overview. This “silo effect” makes consistent documentation and performance comparison nearly impossible, creating a strategic intelligence gap that prevents decision-making. For a portfolio with hundreds of locations, this data fragmentation doesn’t just obscure savings—it actively manufactures operational chaos.
The Visibility Gap: Challenges in Scaling Multi-Site Energy Management
Managing energy across dozens or hundreds of buildings is an operational nightmare. Inconsistencies in meters, Building Management Systems (BMS), building age, and the practices of local teams compound to create a chaotic and unmanageable data environment. Each site speaks a different technical “language,” uses different data formats, and operates on different schedules.
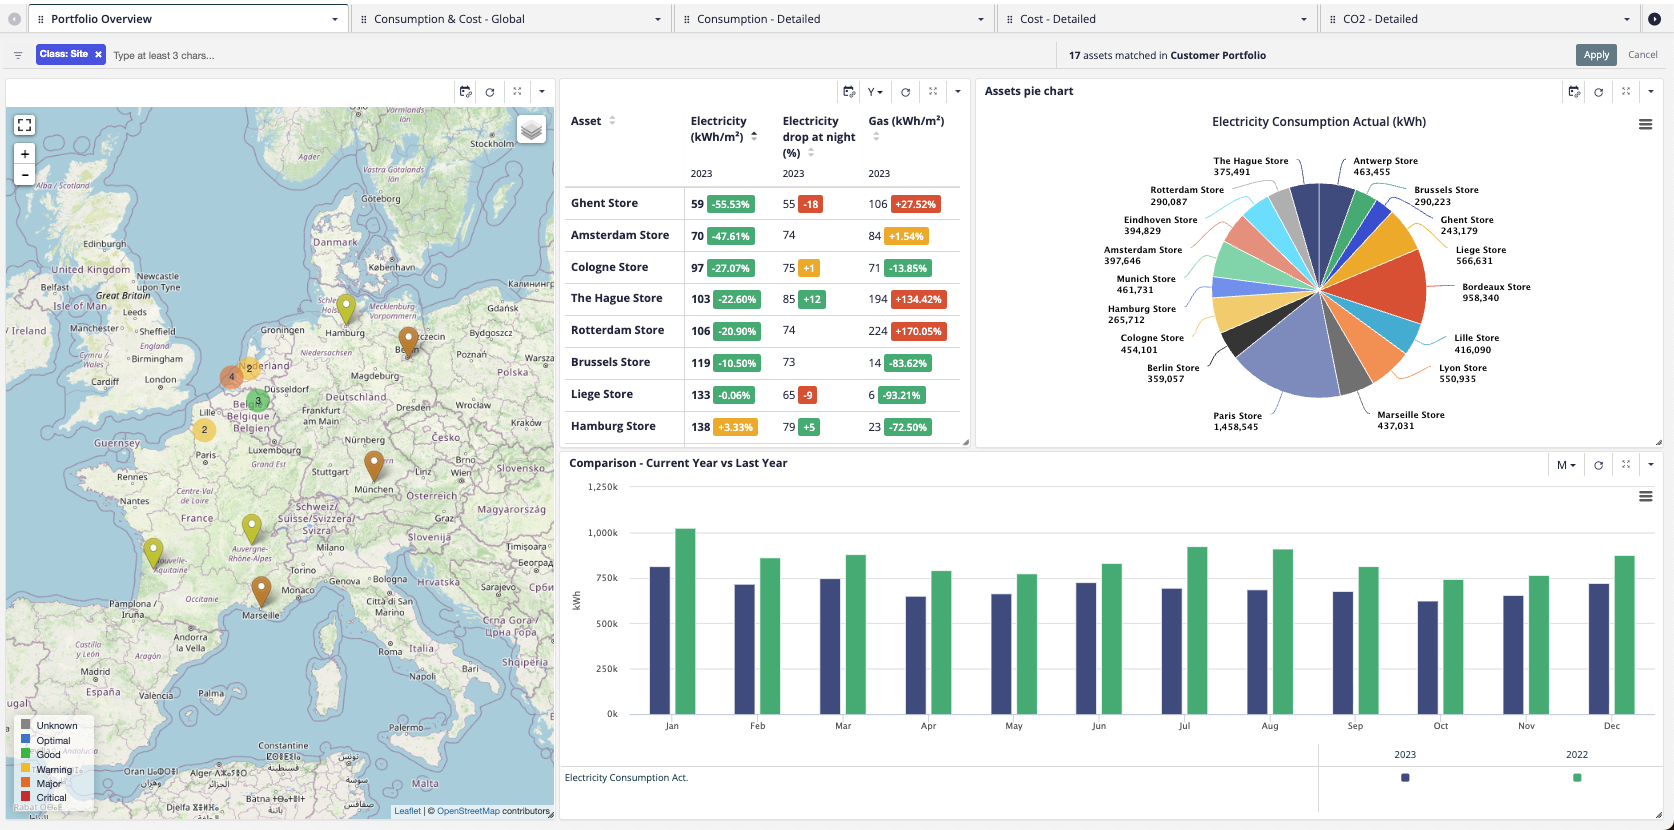
The "Apples to Oranges" Benchmarking Problem
The core challenge for any portfolio manager is the inability to accurately benchmark performance. Inconsistent standards make it difficult to compare building efficiency across diverse geographic locations and building types. Data arrives in different formats and at different intervals—such as minutely generation data from a solar installation versus hourly distribution data from a utility provider—preventing the cohesive analysis needed to identify and diagnose poor-performing assets.
This forces managers into a reactive state, unable to separate the best-performing sites from the laggards. The critical need, as highlighted by our customers, is to get “a lot of different sites on one clear dashboard and be able to recombine them and have a clear overview.”
The Four Lenses of Failure: A Persona-Based Pain Matrix
The Portfolio Manager: Achieving Unified Oversight
Portfolio Manager Pain Point
- Inconsistent Benchmarking: Inability to compare sites fairly due to differences in size, location and data format.
- Fragmented Reporting: Lacking a single source of truth for the entire estate.
- Inability to Scale Best Practices: Good performance at one site cannot be easily replicated.
Energis.Cloud Solution
- Normalized KPIs: Applies normalized metrics (e.g., weather-normalized usage) for true benchmarking.
- Multi-Level Dashboards: Offers a hierarchical view from the entire portfolio down to a single meter.
- Centralized Asset Management: Allows teams to track site events and scale successful initiatives.
The Energy Manager: Drowning in Data, Starving for Insight
The Energy Manager’s struggle is one of time. They are often highly skilled engineers forced to act as manual data entry clerks, spending hours cleaning spreadsheets instead of optimizing performance.
Portfolio Manager Pain Point
- The Manual Burden: Spending 70% of the week collecting and cleaning data from disparate utility portals.
- "Data Fatigue": Inability to evaluate the impact of actions due to non-standardized data.
- Compliance Burdens: Difficulty generating consistent reports for ISO 50001 or the EED.
Energis.Cloud Solution
- Automated Centralization: Direct integration with 100+ connectors (DSOs, BMS, IoT) to eliminate manual entry.
- Actionable Analytics: Provides valuable content for instantly identifying trends.
- Compliant Reporting: Automatically generates detailed PDF reports for ISO 50001, EED, and CSRD compliance.
The Facility Manager: Moving from Firefighting to Precision
The traditional facility manager is trapped in a cycle of reactive maintenance, responding to equipment failures or water leaks only after a surprisingly high utility bill arrives.
Facility Manager Pain Point
- Reactive Cycles: Discovering issues like water leaks weeks or months late.
- "Alarm Fatigue": Receiving constant, irrelevant alerts from basic systems.
Energis.Cloud Solution
- Real-Time Anomaly Detection: Identifies issues the day they occur (e.g., fixing a 70 m³/day leak instantly).
- AI-Driven Waste Detection: Learns a site's expected profile and triggers alerts only on significant deviations.
The CFO: Securing Financial Predictability and Accuracy
For the CFO, energy is one of the most volatile areas of spend. Without granular, high-integrity data, utility bills go unchallenged and capital is wasted on aging equipment. The objective here is to move from “estimated costs” to auditable financial performance.
CFO Pain Point
- Unchallenged Utility Bills: Inability to verify billing accuracy or identify overpayment.
- Budget Volatility: Market price fluctuations create high risk for annual financial planning and forecasting.
- Unverifiable Gains: Difficulty proving that energy initiatives actually impacted the bottom line.
- High Time-to-Value: Traditional projects require long payback periods.
Energis.Cloud Solution
- Invoice Verification & Contract Optimization: Proactively analyzes consumption against terms to identify potential annual savings.
- Data-Driven Forecasting: Uses automated ingestion and historical modeling to create high-accuracy budget forecasts.
- IPMVP-Compliant Protocols: Quantifies savings using international standards, providing audit-grade proof of performance.
- Rapid Payback: Delivers measurable ROI quickly. The average payback for the subscription is just 19 calendar days.
The Risk of Inaction: Compliance and Corporate Value
In the current regulatory and economic climate, the decision to remain with legacy systems is not a neutral choice but an active and escalating business risk.
- 4.1. Regulation is No Longer Optional:
The EU’s Energy Efficiency Directive (EED) and Corporate Sustainability Reporting Directive (CSRD) have shifted compliance from “nice-to-have” to a legal mandate. For organizations consuming over 7.5 GWh per year, certified Energy Management Systems (like ISO 50001) are often required. Without a centralized way to track and report this data, Portfolio Managers face significant financial penalties and a massive administrative burden.
- 4.2. The Emerging ESG Value Premium
There is now a direct link between energy transparency and corporate valuation. Data from Deloitte shows that companies with higher ESG scores can see a 1.2x higher trading multiple (EV/EBITDA). For a Portfolio Manager, mastering energy data isn’t just about saving Kilowatts; it’s about protecting the market value of the entire estate. Failing to digitize creates a “pincer movement”: direct penalties on one side and market value erosion on the other
The Solution: Scaling Multi-Site Energy Management with Energis.Cloud
Energis.cloud is not merely a piece of software; it is an Operational Engine designed to standardize multi-site chaos into a clear, manageable, and data-driven system.
| Operational Pillar | The Legacy Approach (Manual & Siloed) | The Energis.Cloud Approach (Unified & Automated) |
|---|---|---|
| Data Ingestion | Monthly invoices and manual meter reads with 30-day lag. | Real-time, automated data flows from DSOs, BMS, and APIs. |
| Portfolio Analysis | Siloed datasets; “Apples-to-Oranges” guesswork. | Unified Benchmarking using normalized, high-integrity KPIs. |
| Compliance & Reporting | Weeks of manual data cleaning and report preparation for local or international frameworks. | Automated Reporting: One-click, audit-ready PDF reports at portfolio scale. |
| Anomaly Detection | Detecting leaks or waste only when the high bill arrives. | AI-Driven triggers anomaly detection the moment a deviation occurs. |
| System Autonomy | High dependency on external vendors for every minor change. | SelfCare Modules allow managers to configure and scale independently. |
Conclusion
Secure Your Portfolio’s Future In a landscape of rising regulation and price volatility, fragmented data is a liability you can no longer afford. Transitioning to a centralized, intelligent platform isn’t just a technical upgrade—it’s a strategic necessity. Energis.cloud bridges the gap between site-level chaos and portfolio-wide clarity, transforming your energy data into auditable financial performance.
To see how we turn multi-site complexity into a managed asset, discover our Consumption Monitoring App or book a demo today to start your journey toward portfolio-wide mastery.
Frequently Asked Questions
Why is scaling multi-site energy management more difficult than single-site monitoring?
Scaling introduces “data silos” where different buildings use incompatible meters and systems. Without a centralized platform, managers are forced into manual data collection, leading to inconsistent “Apples-to-Oranges” benchmarking. A unified engine standardizes this technical chaos into a single source of truth for the entire portfolio.
How do you accurately benchmark energy performance across different geographic regions?
To achieve fair benchmarking, you must use Normalized KPIs. This process accounts for variables like building size and local weather conditions. By normalizing data, Portfolio Managers can compare a store in Berlin to one in Marseille on an even playing field, identifying true laggards and top performers.
Can your platform integrate data from PV, EV charging, and Battery Storage (BESS)?
Yes. Modern energy management requires centralizing disparate infrastructure. Our platform integrates data from Solar PV inverters, EV charging networks, and Battery Energy Storage Systems (BESS) alongside traditional utility data and Building Management Systems (BMS) to provide a 360-degree view of your energy estate.
How does automated reporting assist with ISO 50001 and CSRD compliance?
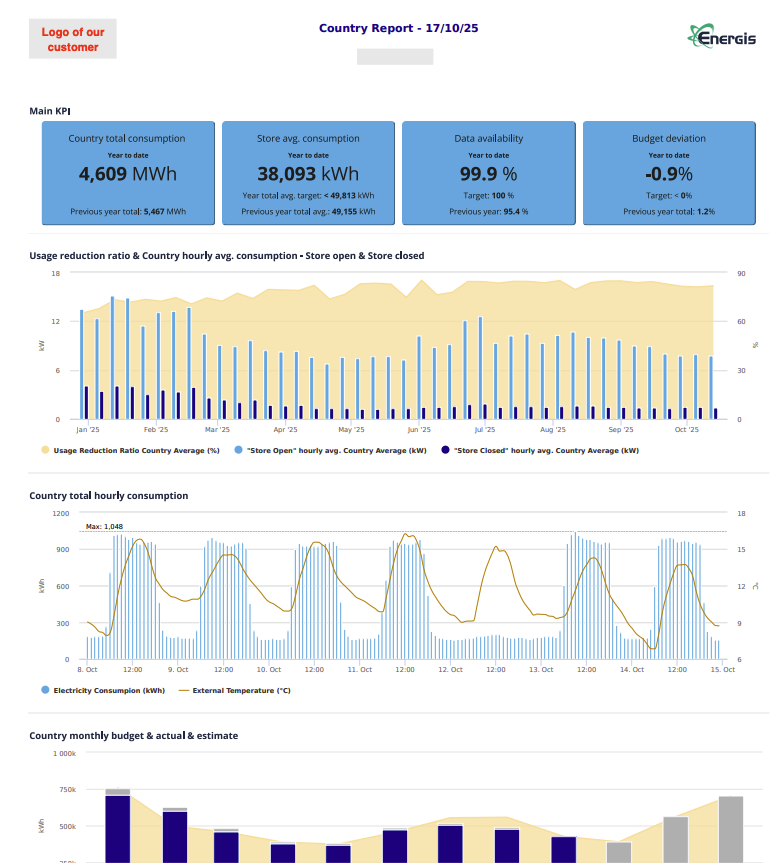
Manual reporting for dozens of sites is prone to error and “Data Fatigue.” Scaling multi-site energy management with automated reporting provides audit-ready PDFs. These reports track critical metrics like Data Availability (99.9%) and Usage Reduction Ratios, ensuring your organization meets mandatory EED and CSRD requirements with high-integrity data.
What is the impact of "Night Drop" analysis on a multi-site portfolio?
Night Drop analysis identifies the percentage of electricity consumption reduction during non-operational hours. Across a large portfolio, identifying sites that fail to “power down” reveals significant “low-hanging fruit” for savings without requiring capital-intensive equipment upgrades.


